Serial.println(“Why?”);
When writing software for Linux, Mac, Windows, iOS, Android etc, we have all the benefits of being able to debug directly on the target platform (or, in the very least, to use software-based Remote Debuggers on the target platforms)
Debugging is absolutely essential for producing reliable, workable, maintainable code.
The problem is that MCUs and Development Boards rarely come with the hardware necessary to attach a debugger… so, what do we do?
If you’ve ever written code for an MCU before, there’s a 99.99% chance that you have resorted to the use of “debug messages” to interrogate the values of important variables/members within your program.
Serial.println("This is an annoying debug message!")
If you’re doing this, then you’re actually changing the code you’re trying to debug and test.
The problem with Print
No, I’m not talking about how the Internet has ruined the Print Media Industry.
I’m talking about the use of “output messages” and “debug code” to interrogate the inner-workings (or “state”) within your programs.
Before I explain the biggest problem with this approach, I shall let the renowned scientist, Hubert J. Farnsworth, put it into words:
Any code you add for the purpose of observing the code your program needs can fundamentally alter the outcome of your code.
This is particularly true when you add code to output text (string) information to a console, screen, or UART/Serial interface. Why? Because, whenever you declare a static, or convert a value dynamically to a String, it consumes additional memory.
This directly alters the state of your program and, depending on the type of issues you’re experiencing, or how close to the maximum consumption of memory your program may be at that moment, can either make it impossible to diagnose your issues; or even cause additional (potentially worse) issues.
Beyond. the risk of altering your program’s state in an attempt to interrogate it, attempting to debug using “debug code” and “output messages” is woefully inefficient.
There’s a Better Way!
So, what is the proper way of debugging our code?
What we need, ultimately, is a way of stopping our code at any point we want, and interrogating the values of everything and anything we consider relevant. Local and Global Variables, Method Parameters, Class and Struct Members… we need to be able to look at them all.
In software development for conventional Operating Systems, this functionality is standard in virtually all IDEs. When it comes to Microcontroller software development, things become a little more… fractious.
It starts with a real IDE
If you want any hope of debugging your code, the first thing you need to do is ditch the Arduino IDE.
While the Arduino IDE is designed to be easy for newcomers to development, it is – fundamentally – not a true IDE. It lacks critical tooling required for real-world development projects; and does not even provide a legitimate experience of C/C++ programming.
Debugging is entirely beyond the capability of the Arduino IDE, as are a large number of other features that, at the end of the day, make coding more efficient and – for some of us – even fun.
I was about to produce a list of these features for this article, only to realise that they are so numerous and require such considerable detail that a mere list would not do them justice.
Let us just say that the Arduino IDE is not a real IDE, and you cannot properly debug your code using it.
Introducing: PlatformIO
PlatformIO is the ultimate IDE toolchain for Embedded Development (development for Microcontrollers such as ESP and Arduino).
It runs on the Visual Studio Code platform, and both Visual Studio Code and PlatformIO are free of charge!
This means you can quickly and easily set up a comprehensive development environment for all of your Microcontrollers at absolutely no cost to you!
Visual Studio Code and PlatformIO run on Windows, Mac, and Linux… so, no matter which Operating System you prefer, you can write professional, maintainable code for your Microcontrollers.
Everything that the Arduino IDE cannot do, the combination of Visual Studio Code and PlatformIO can do.
Indeed, this is why every project on the Flowduino GitHub account is developed and maintained using PlatformIO!
Now, this article isn’t going to go into the detail of how to install Visual Studio Code and PlatformIO. This would not only conflate the article too much, it would be fairly unnecessary as both installations are very simple.
You can find instructions on how to install Visual Studio Code on the official Visual Studio Code Website, and – likewise- you can find instructions on how to install PlatformIO (which is even easier) on the official PlatformIO website.
What do I need to begin debugging my ESP32 Code?
So, this article now presumes that you have already installed Visual Studio Code and PlatformIO. If not, you will need to do so before continuing with this article.
With these software pre-requisites installed, all that remains is the means to connect a software debugger (in this case via Visual Studio Code + PlatformIO using OpenOCD) to your Microcontroller (ESP32) device.
There are a number of options available, however they are all ultimately JTAG devices. JTAG stands for Joint Test Action Group, and defines an industry standard for testing and debugging code on Microcontrollers.

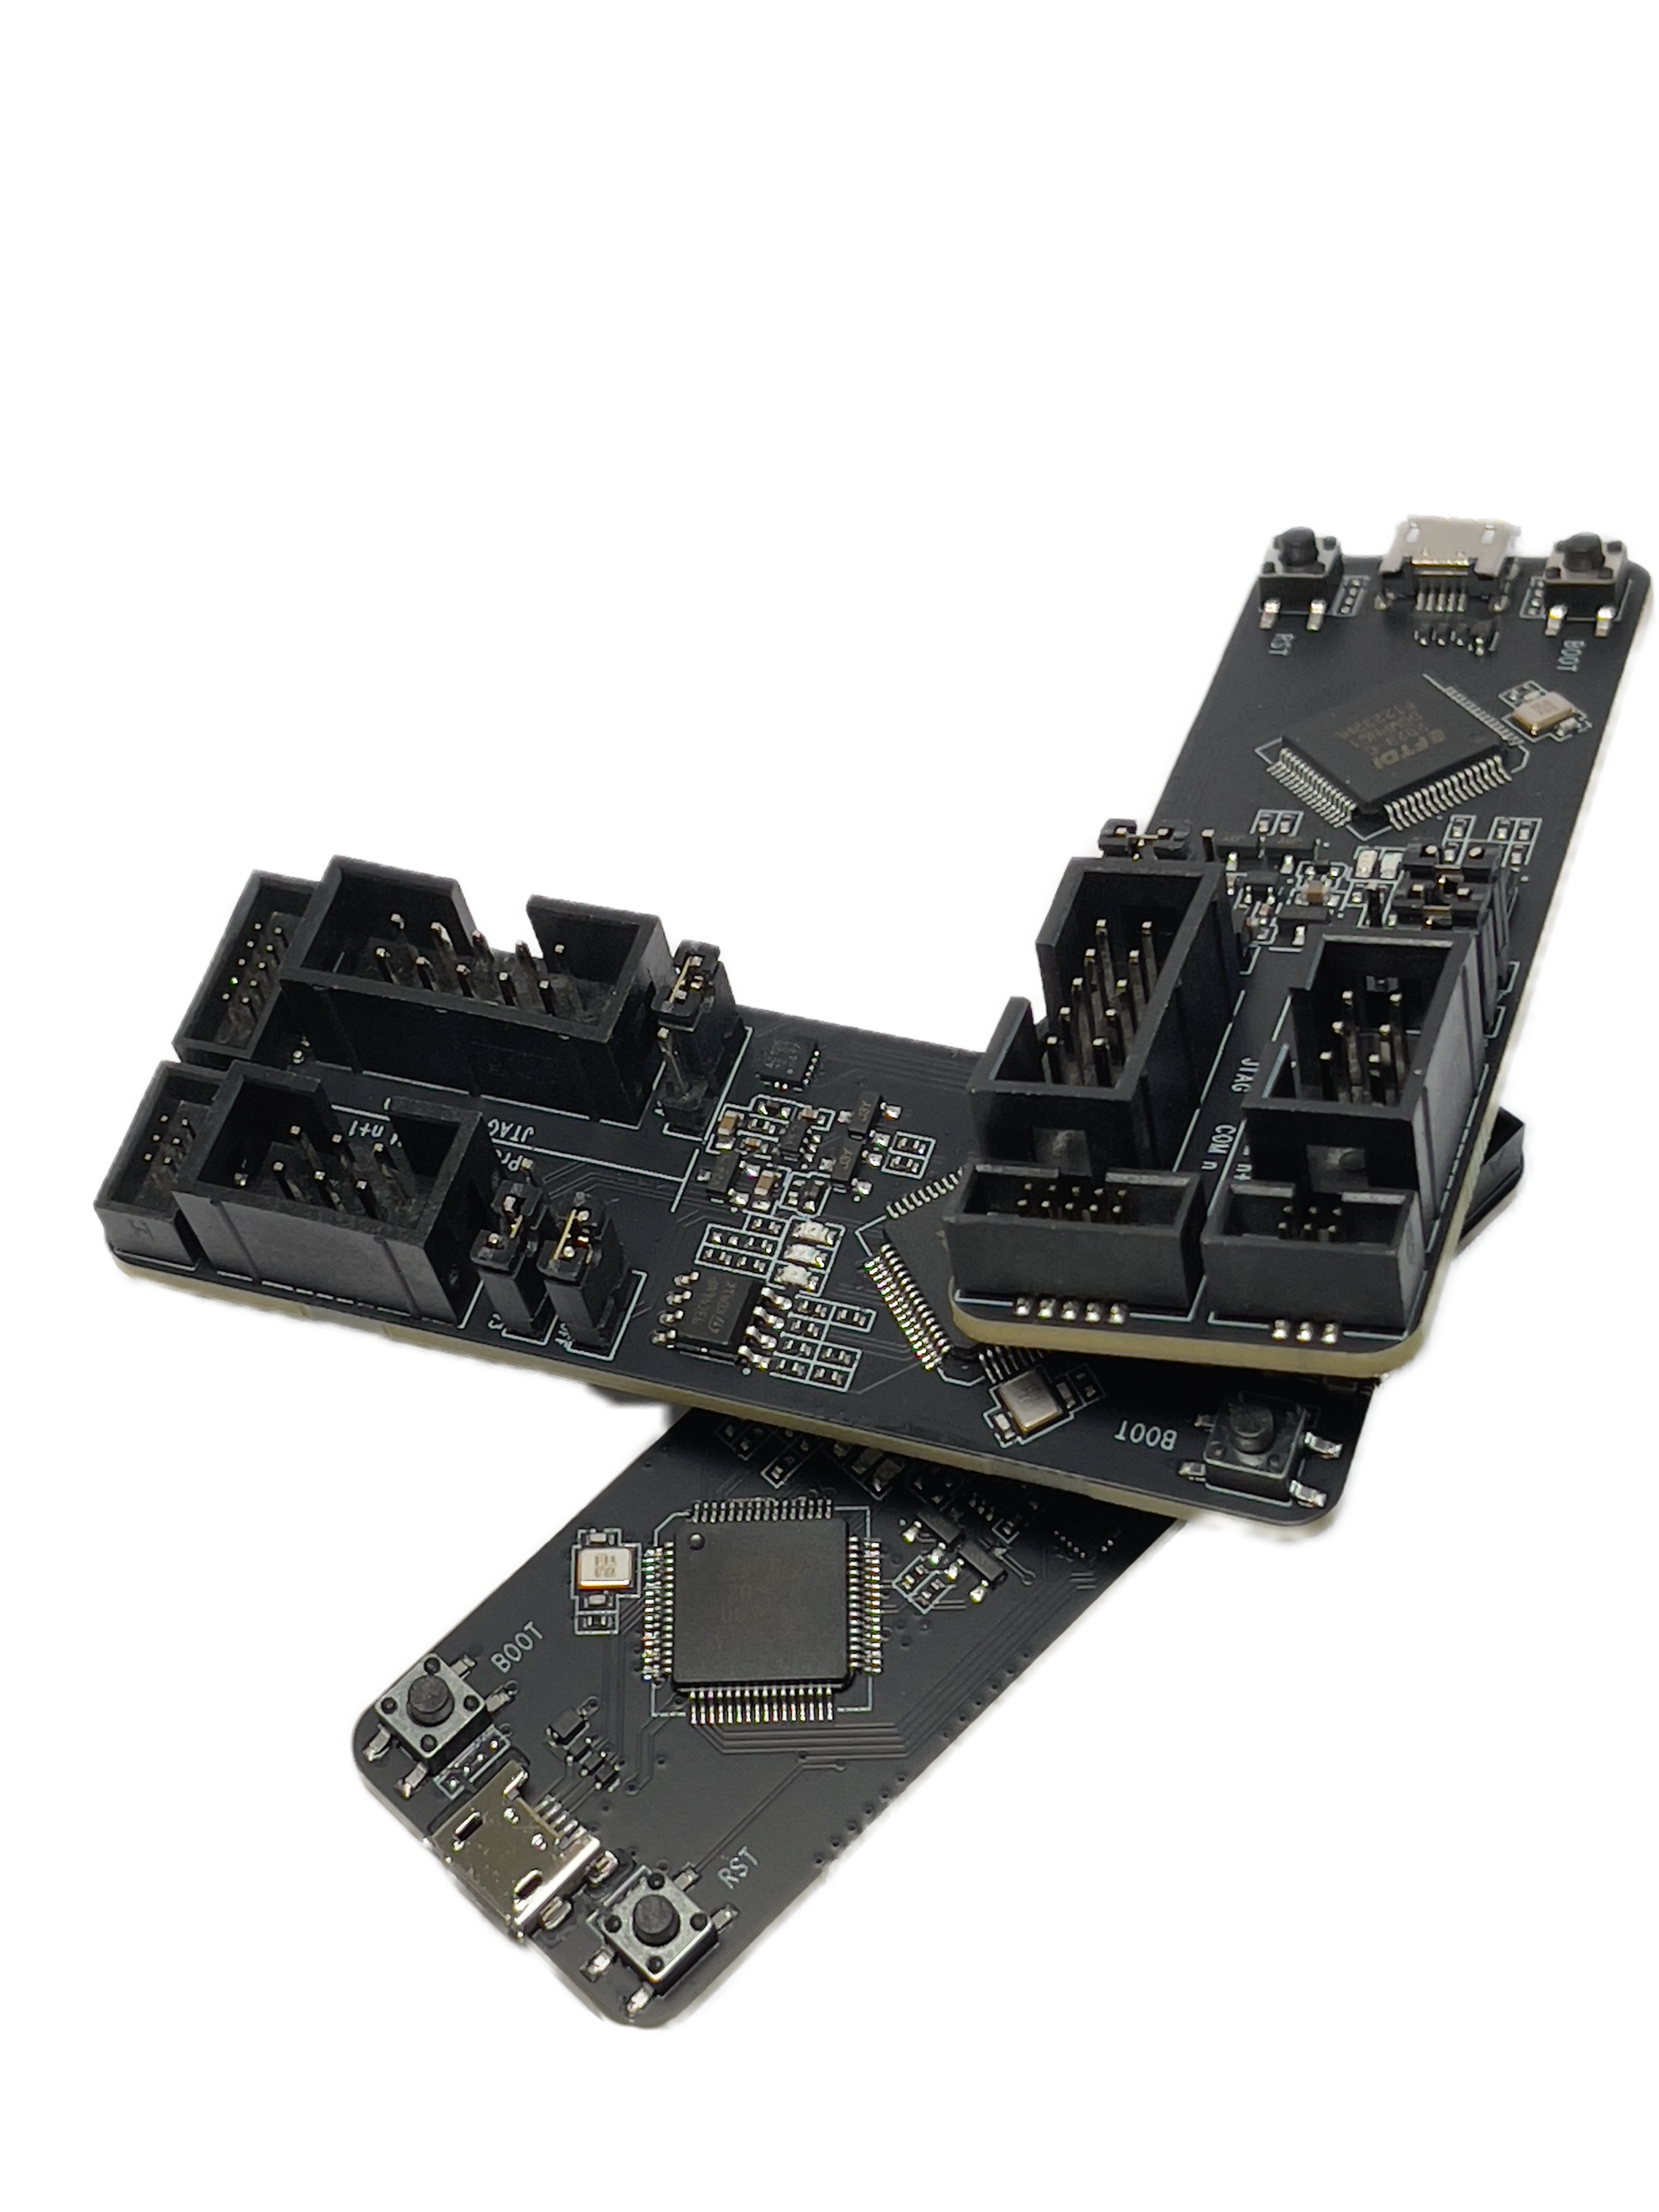
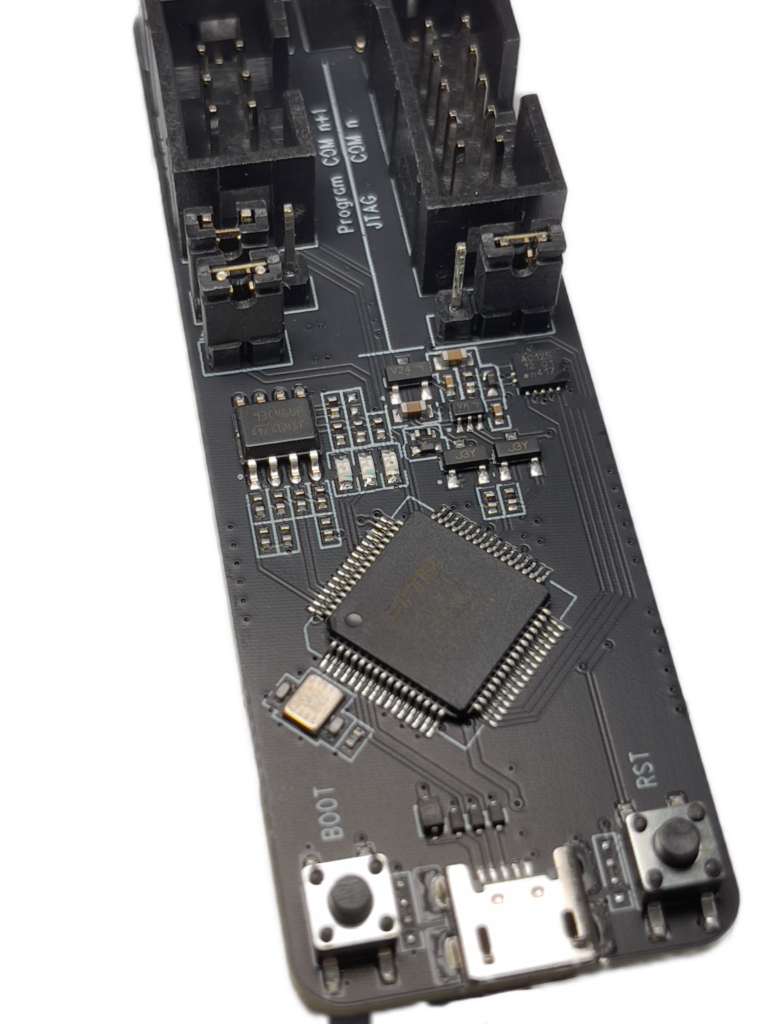
ESP-PROG
Programmer & Debugger
All-In-One
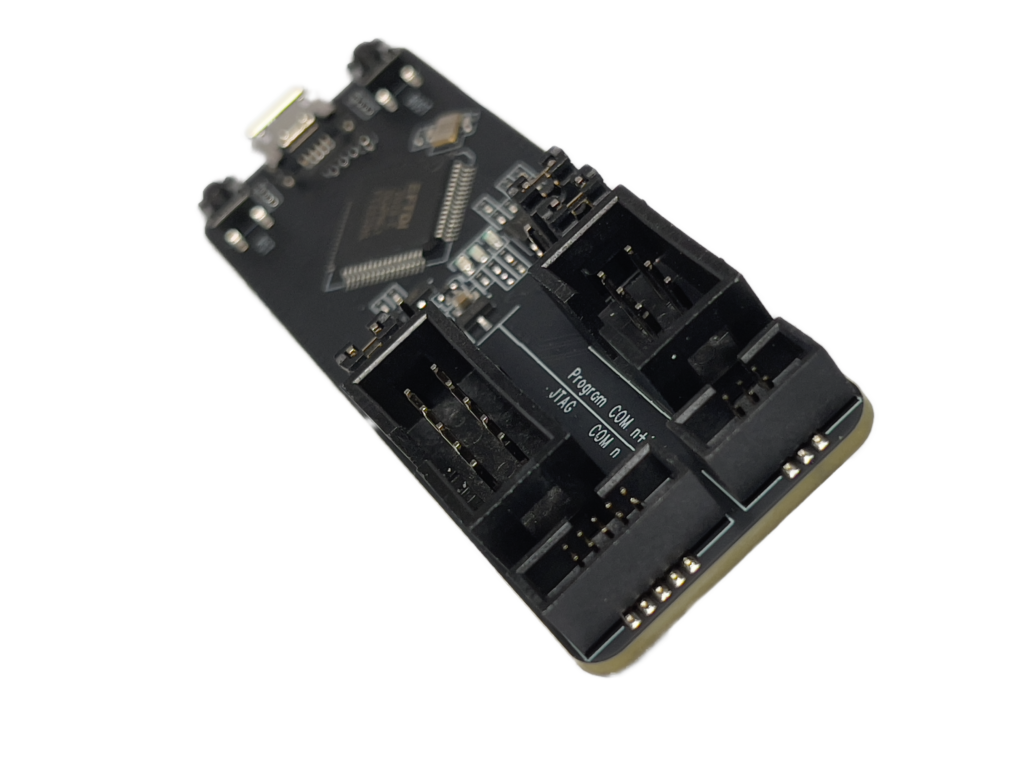
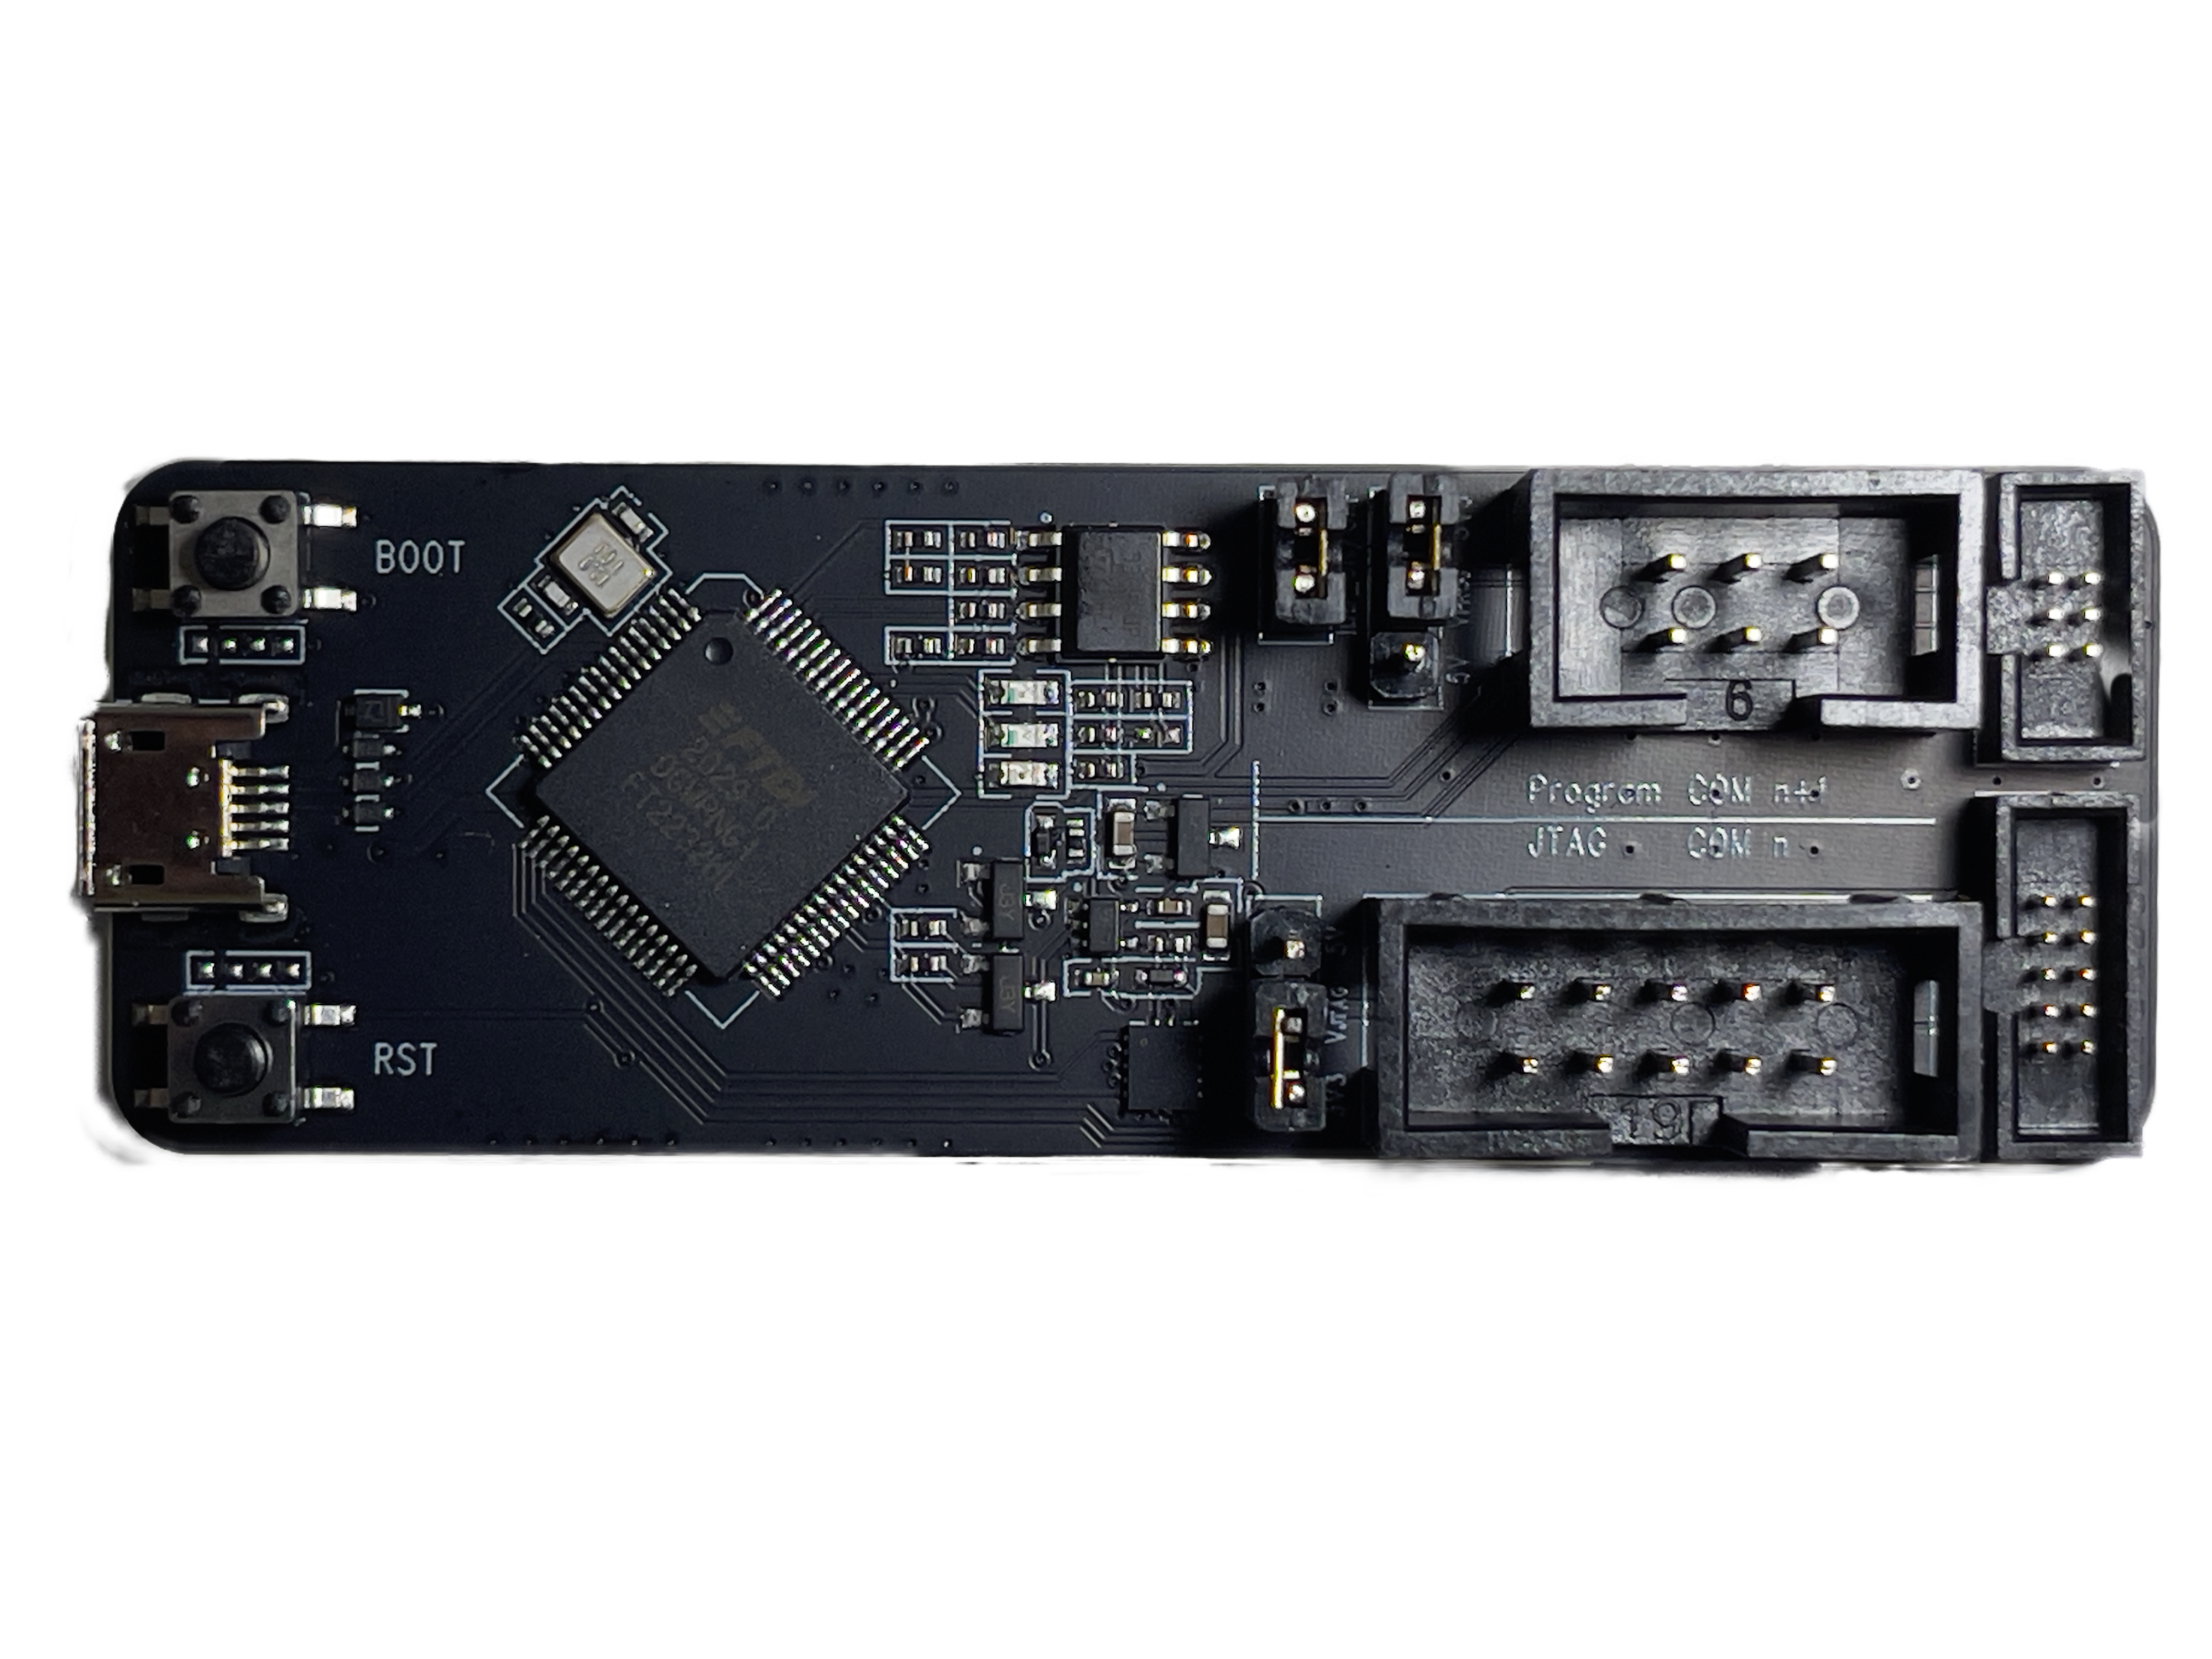
The ESP-PROG board is an official product from Espressif, creators of the ESP32 MCU.
It contains both the Programmer and Debugger hardware, meaning that you can connect it directly to an ESP32 Development Board, and not only Flash your program onto it, but then begin debugging that program immediately… without changing any wires or cables!
In my own experience, shared by those with whom I have discussed this topic, the ESP-PROG board is the best approach to programming ESP32 MCUs, and debugging those programs.
With that in mind, I shall demonstrate how the entire process of setting up ESP32 development boards with ESP-PROG boards for Flashing and Debugging software.
You Will Need:
An
ESP32
Development Board
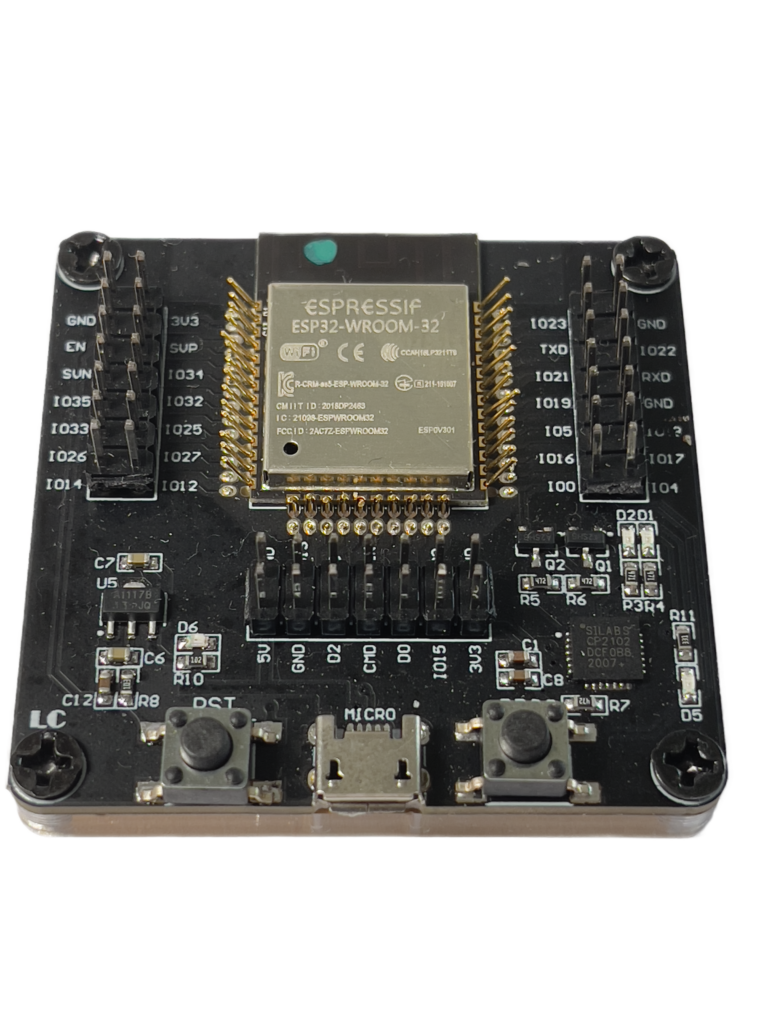
Since we’re going to be flashing code onto an ESP32, and debugging it, you’re definitely going to need to have an ESP32 Development Board to use.
It pretty-much doesn’t matter what kind of ESP32 Development Board you use, but it needs to have specific GPIO pins available (we’ll get to that shortly)
ESP-PROG Board
For this guide, you will need an ESP-PROG board.
These boards are fairly easy to find, though I note that my own preferred electronics retailer does not stock these boards at all.
Still, a quick web search should certainly yield a retailer in your country.
Note: the ESP-PROG board supports both 3.3v and 5v ESP32 Development Boards.

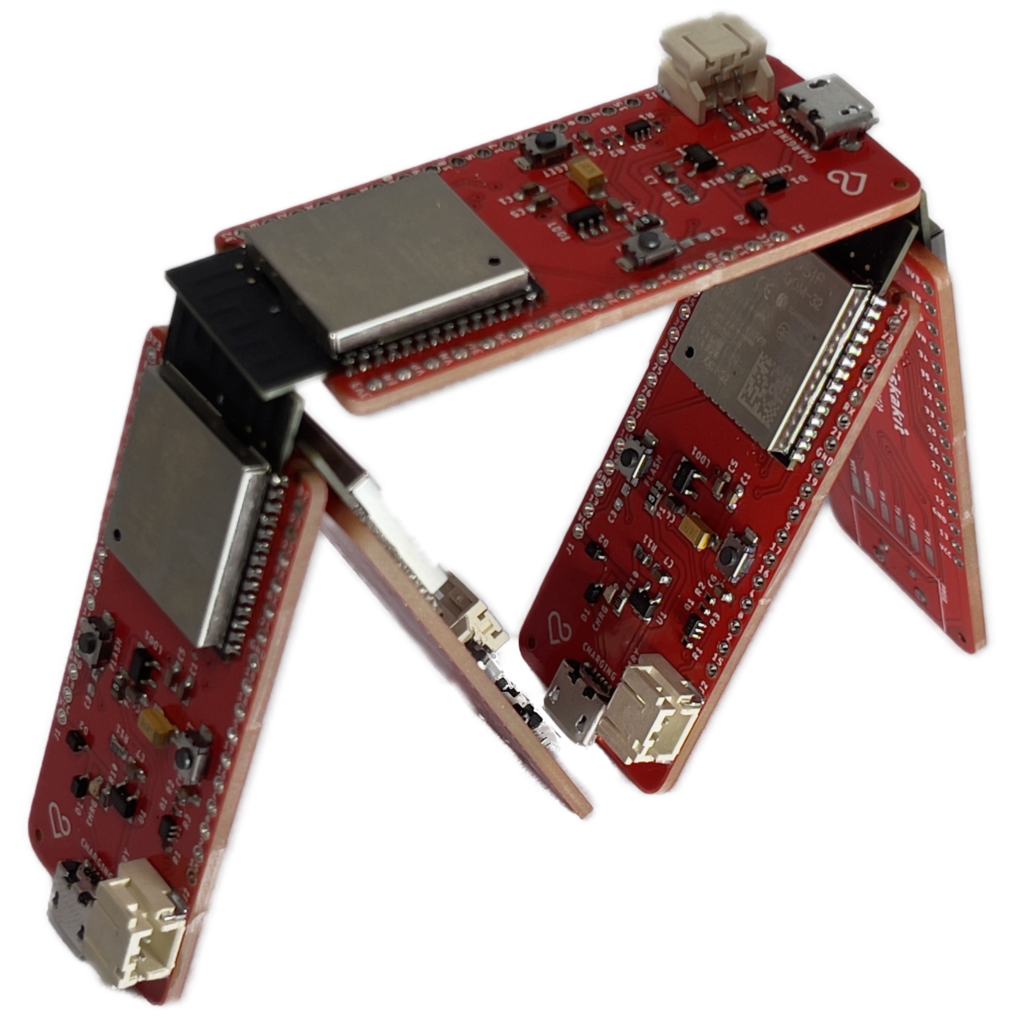
Jumper Wires
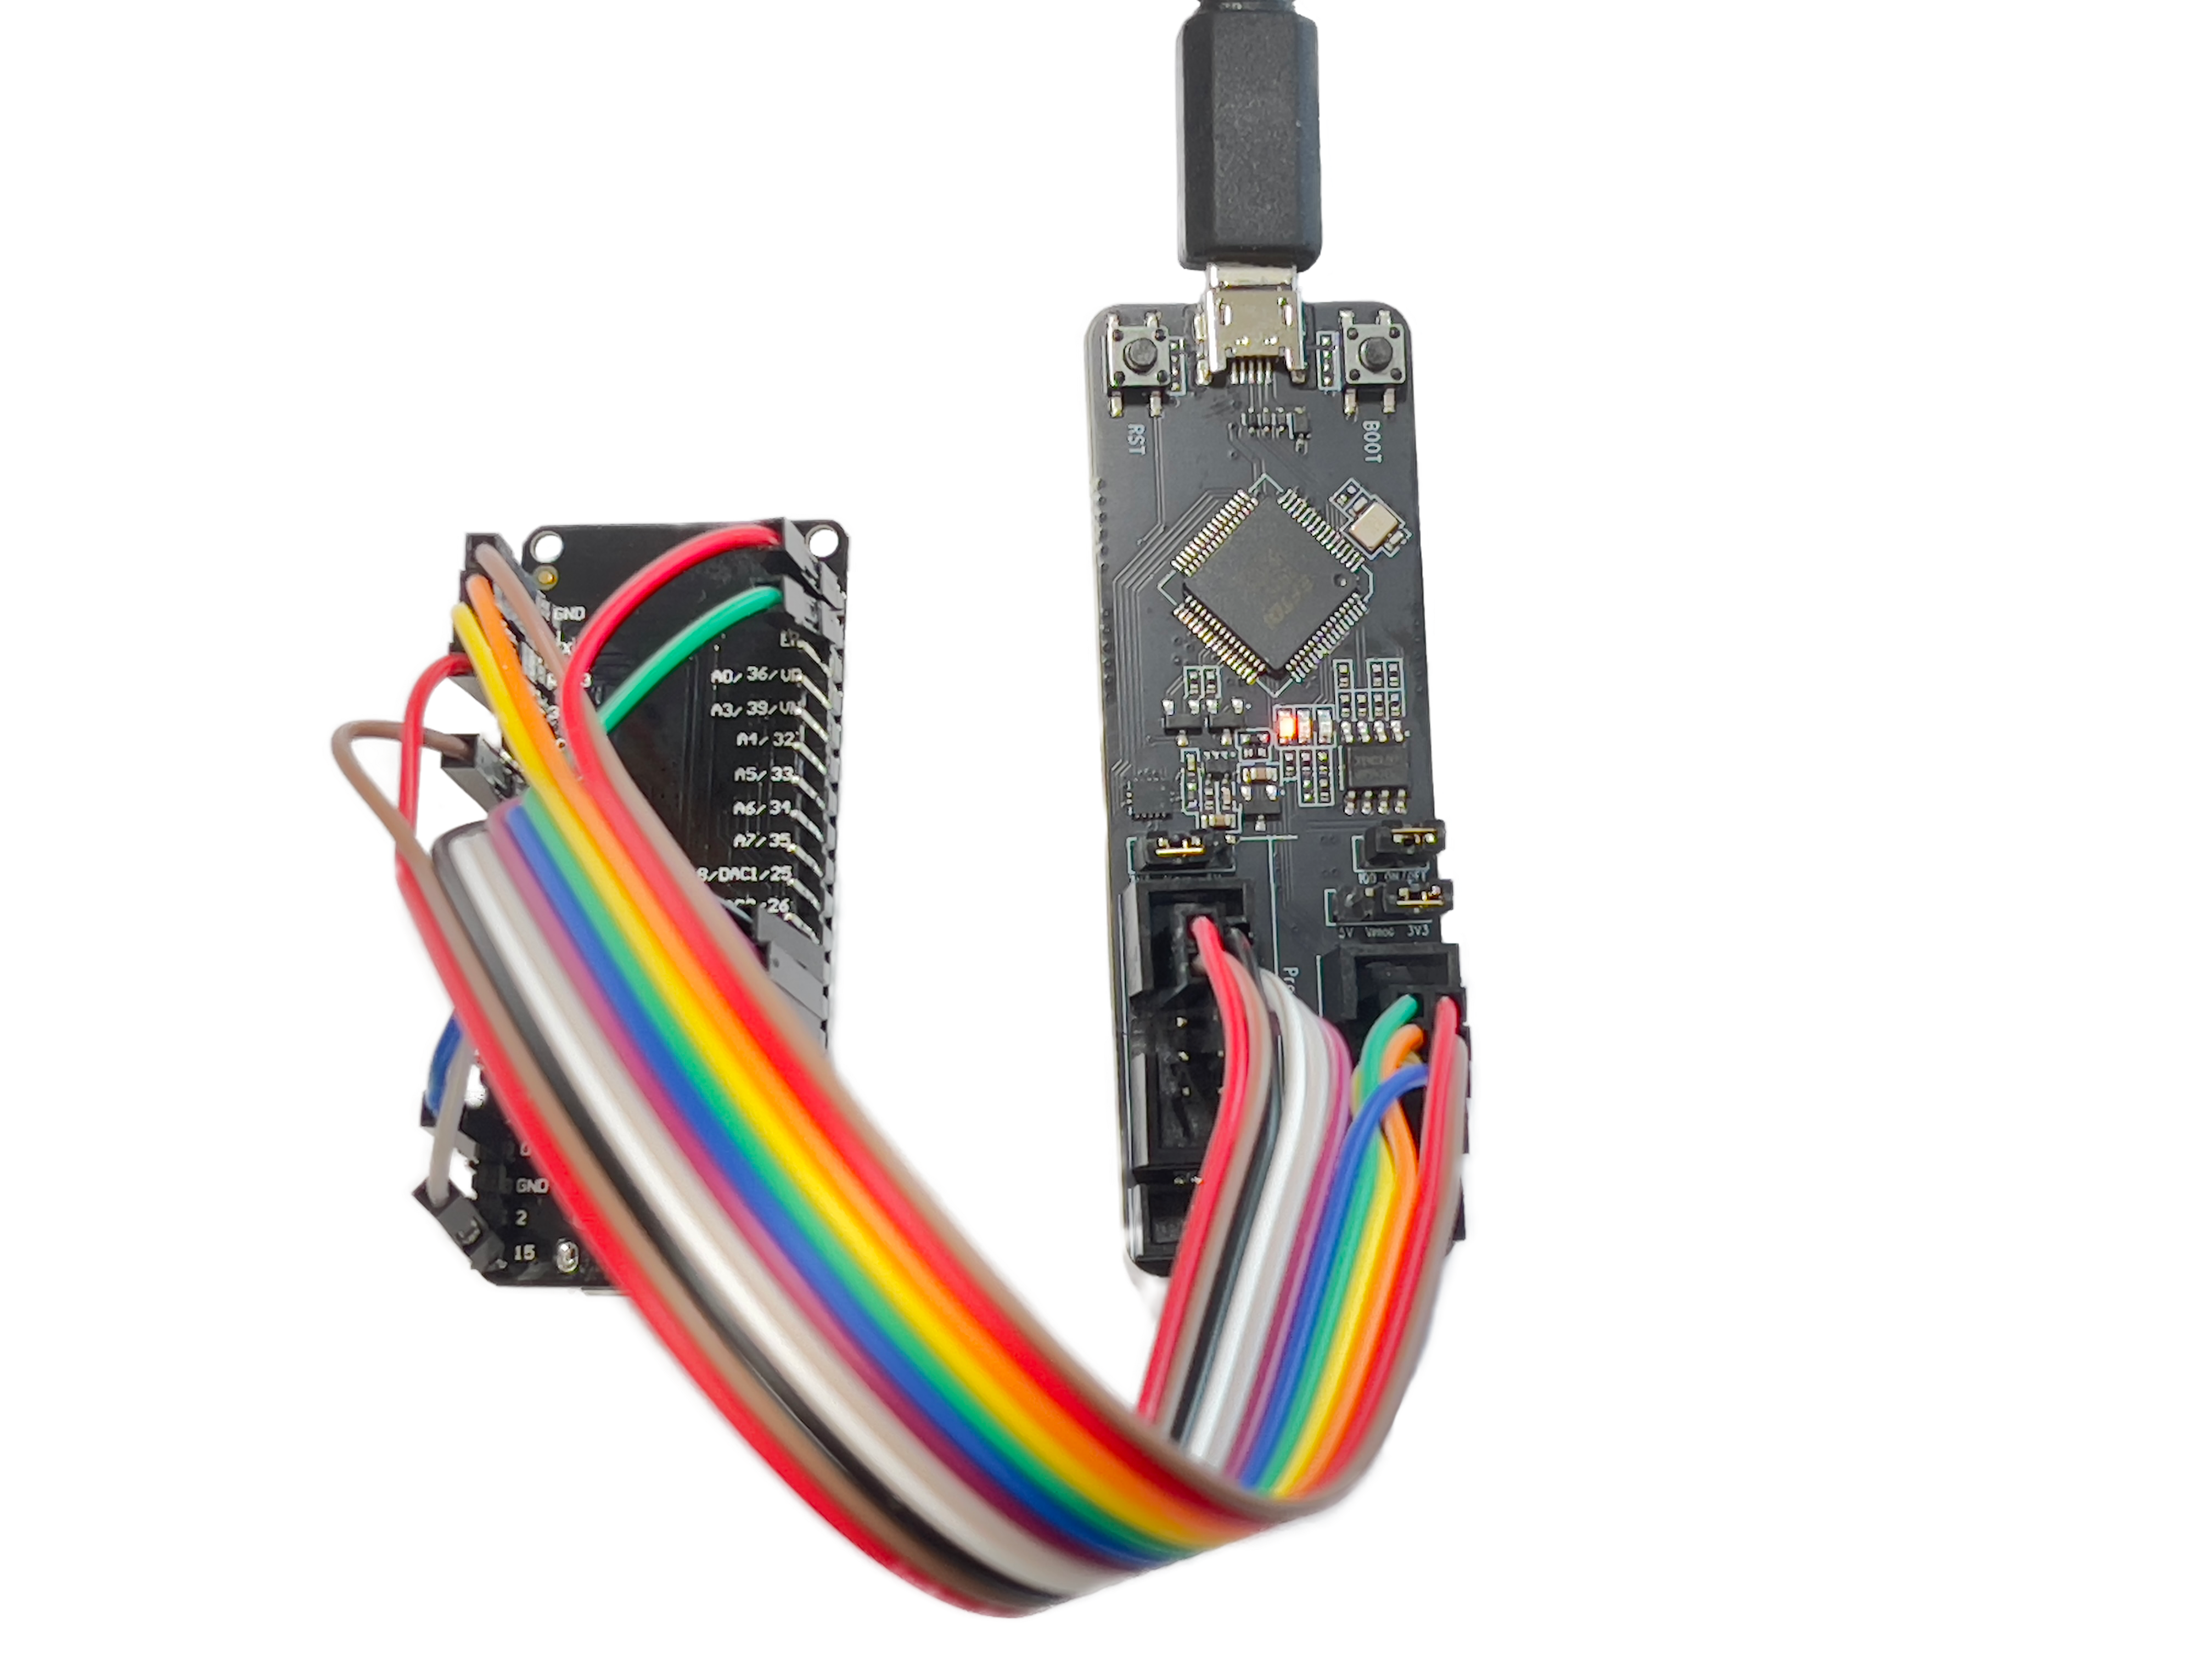
Finally, of course, you will require the best friend of all MCU tinkerers: the ubiquitous Jump Wires!
The connectors on the ESP-PROG board are Male (pins), so you will need Female connectors for that end.
The connectors you need on the receiving end (your ESP32) will depend entirely on how your development/prototyping board is set up.
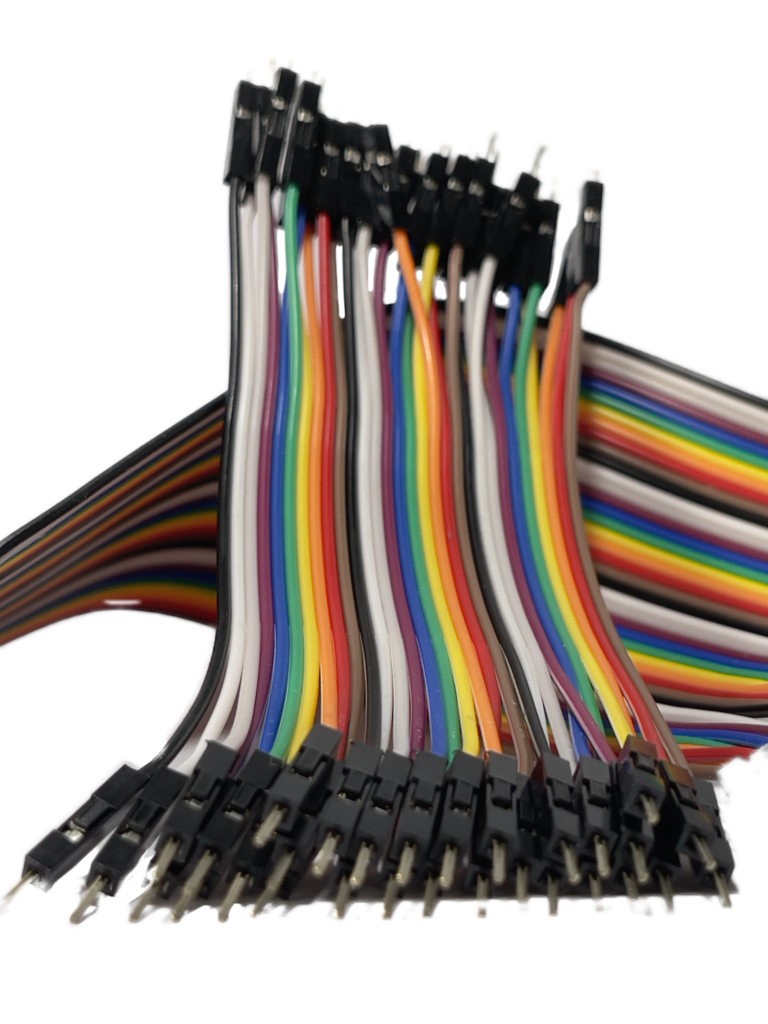
Specifically, you will need 12 jumper wires to connect and use the ESP-PROG board with an ESP32 Development Board.
Note: 2 of these wires are Voltage In (3v3/5v/VIN), and 2 are GND (ground). If your ESP32 only has 3.3v power inputs, both pairs need to be connected, so you (unfortunately) cannot reduce the number of wires required. If your ESP32 supports a 5v power input, you can use 10 wires instead.
Wiring Everything Up
There are some important things of which you must be aware before you begin plugging anything in.
What Voltage does your ESP32 Expect?
ESP32 Development Boards are available with different input voltage expectations. While most I have personally experienced (all but one, in fact) expect a 3.3v supply, some expect a 5v supply.
This is extremely important, as you will damage your ESP32 Development Board if you put 5v through a 3.3v device, and potentially (though less likely) if you put 3.3v through a 5v device.
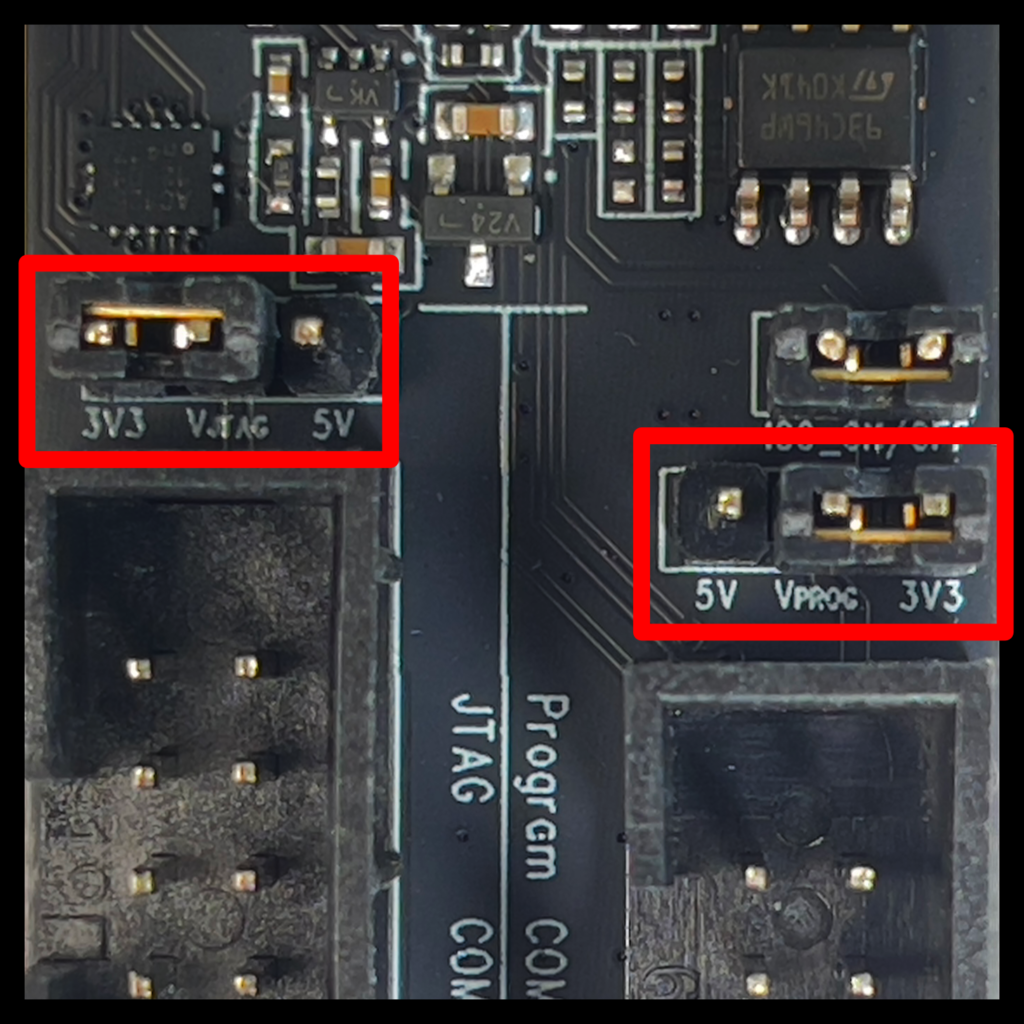
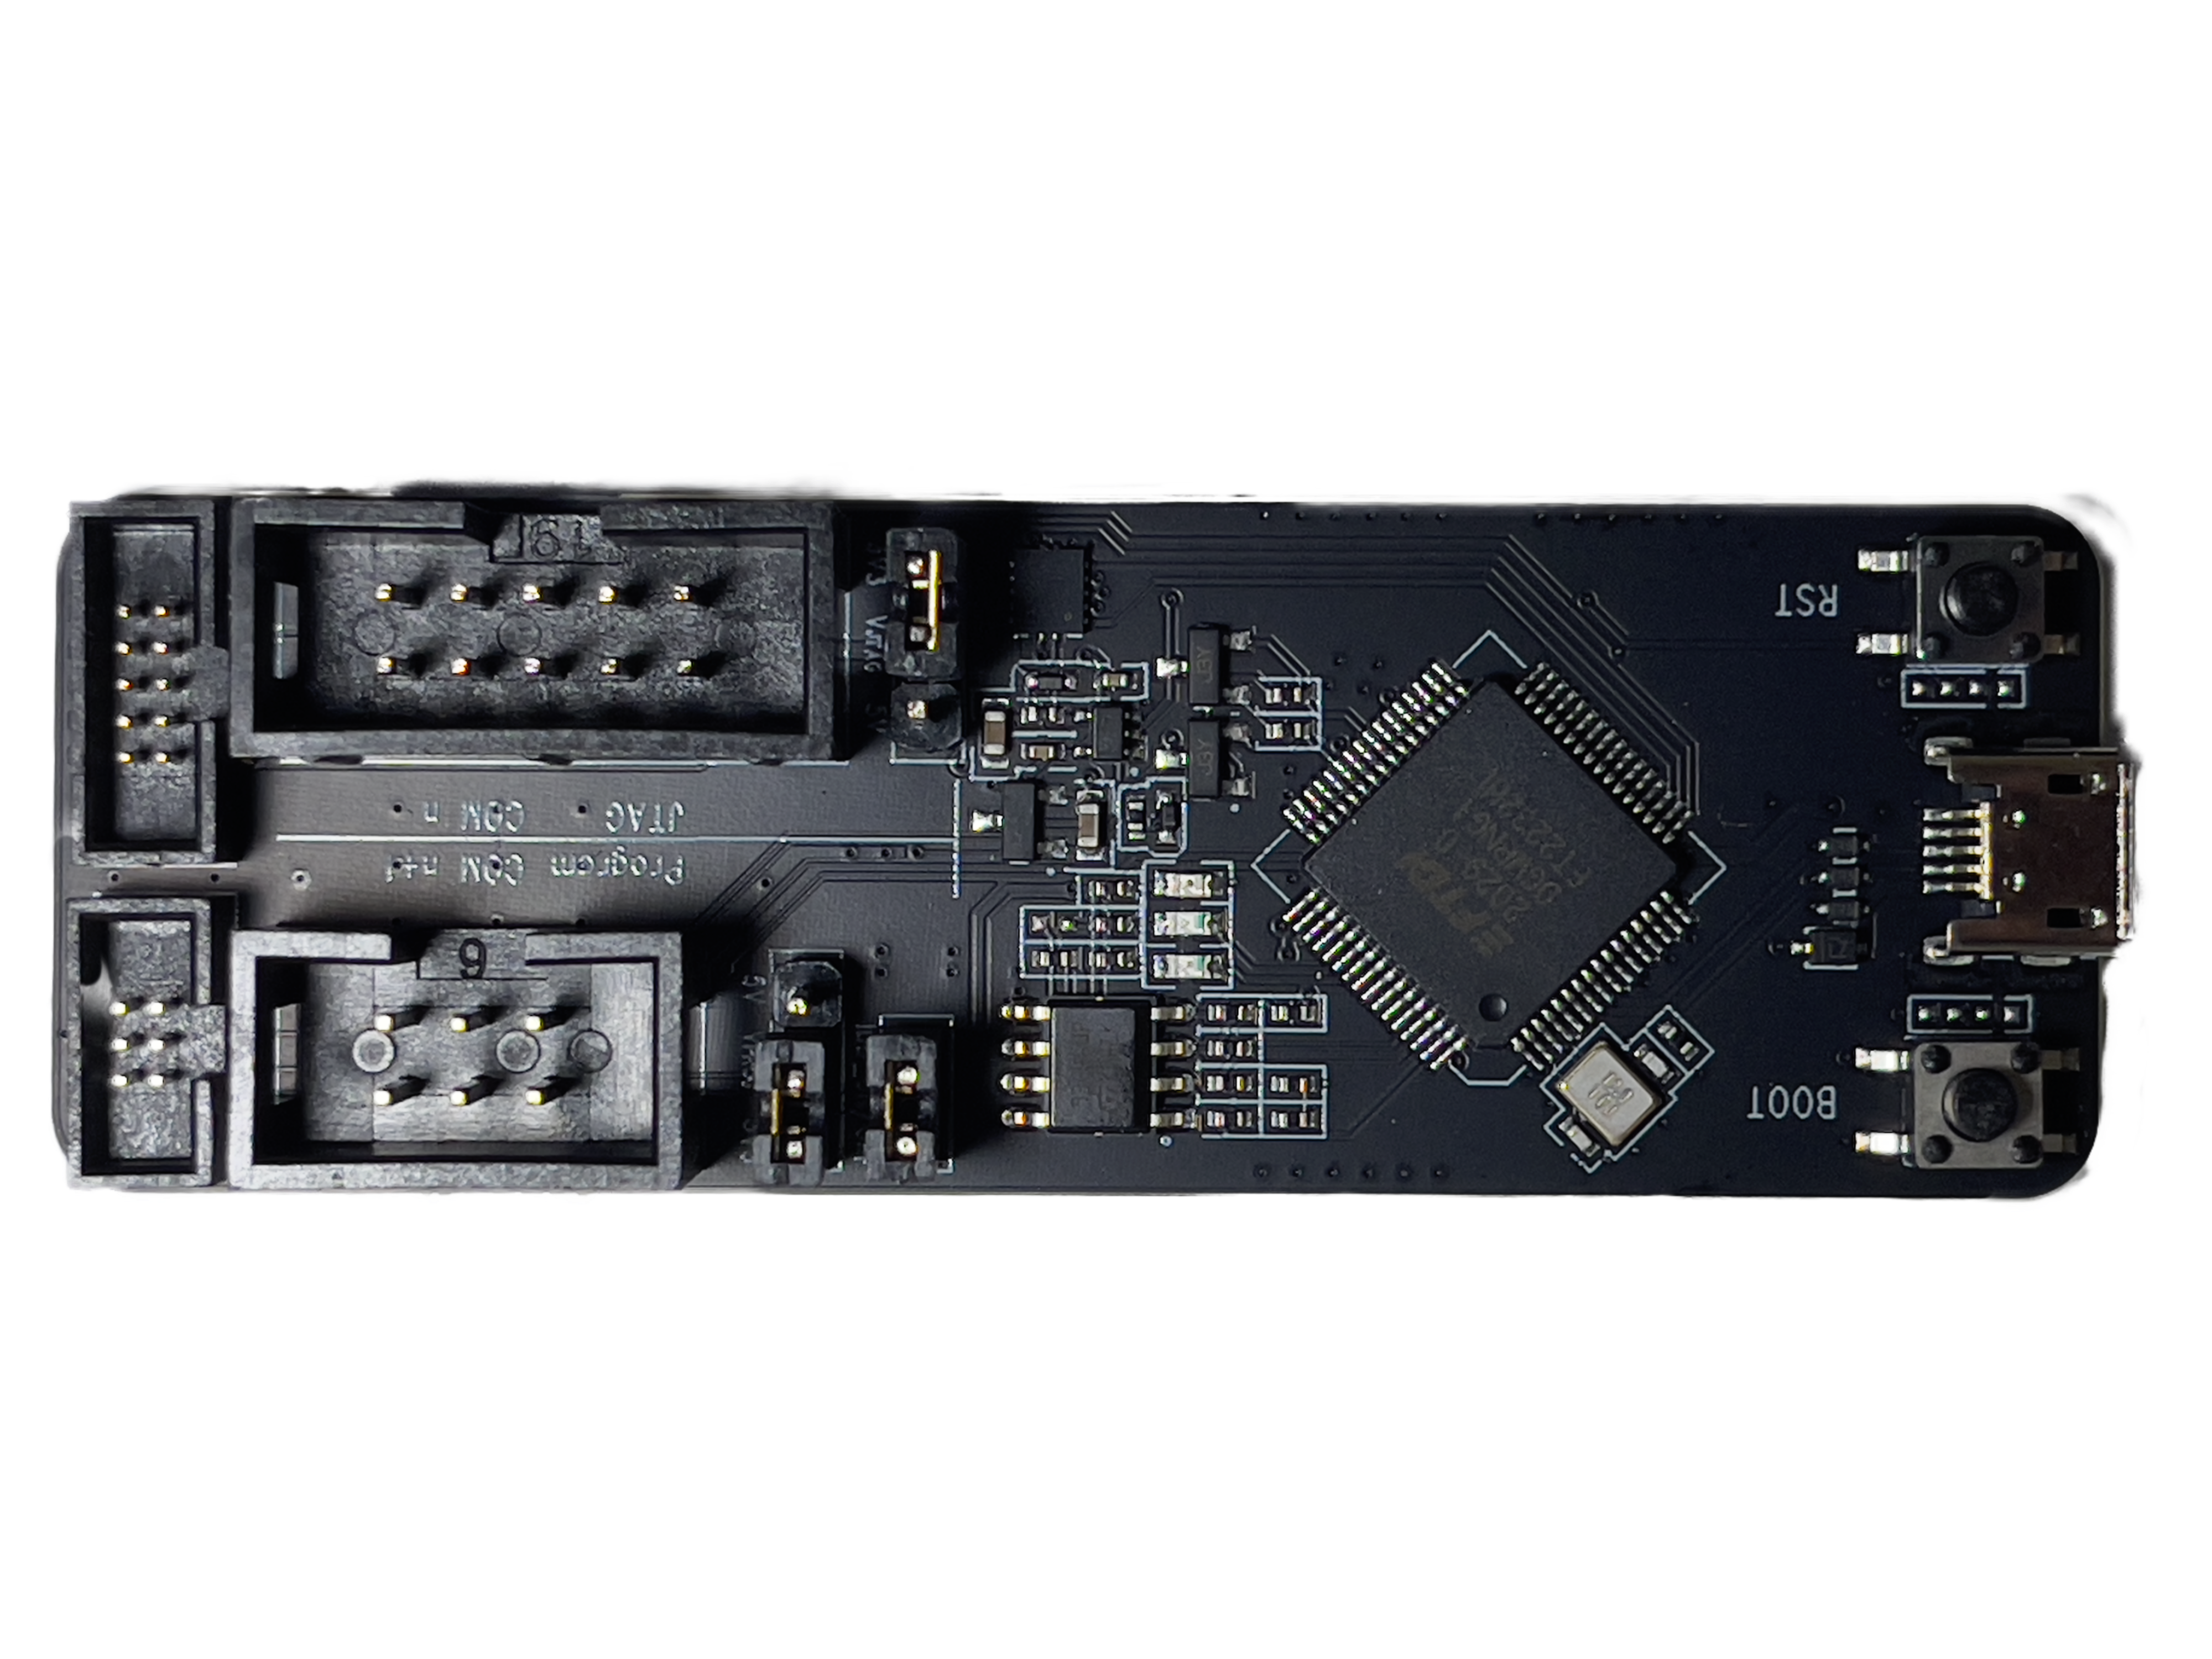
The ESP-PROG board provides two Jumper Headers for the purpose of voltage selection.
Before plugging anything into a power supply (or USB socket on your computer) you must ensure that these jumpers are set to the correct voltage corresponding to the expectations of your ESP32 Development Board.
While the voltages are separated for the Programmer Interface (right-hand side of the photo) and the JTAG Debugger Interface (left-hand side of the photo) in almost all cases, these voltages should be set identically.
Typically, this will mean setting both jumpers to the 3V3 side of their respective Jumper Headers.
No Hot-Wiring!
I know it’s tempting to quickly plug and unplug your jumper wires without disconnecting the power; however, this carries a significant risk of damaging your ESP32 and/or your ESP-PROG board.
Embarrassing as it is to admit, I have destroyed two ESP32 Development Boards by accidentally shorting out connections while moving jumper wires with the power connected. The reason I mention it is that it can happen to any of us!
It is strongly recommended that you don’t plug or unplug any wires without first disconnecting the power from your ESP-PROG board.
If your ESP32 Development Board supports a direct Battery connection, you should make sure you also disconnect this battery.
Wiring
The
Programmer
The ESP-PROG board provides two distinct (but complementing) functions.
Naturally, we have the Debugger function (which is the key objective of this article) but we also have a Programmer function.
The Programmer function enables us to Flash our compiled Program onto our ESP32. While many ESP32 Development Boards integrate some kind of Programmer (or come with a separate Programmer Board) there are considerable advantages to using the Programmer function of the ESP-PROG board.
Primarily: it means that we can configure our IDE/Project so that we can Flash our program onto the ESP32, monitor Serial Input/Output, and Debug our program on the ESP32, all using the same COM Port.
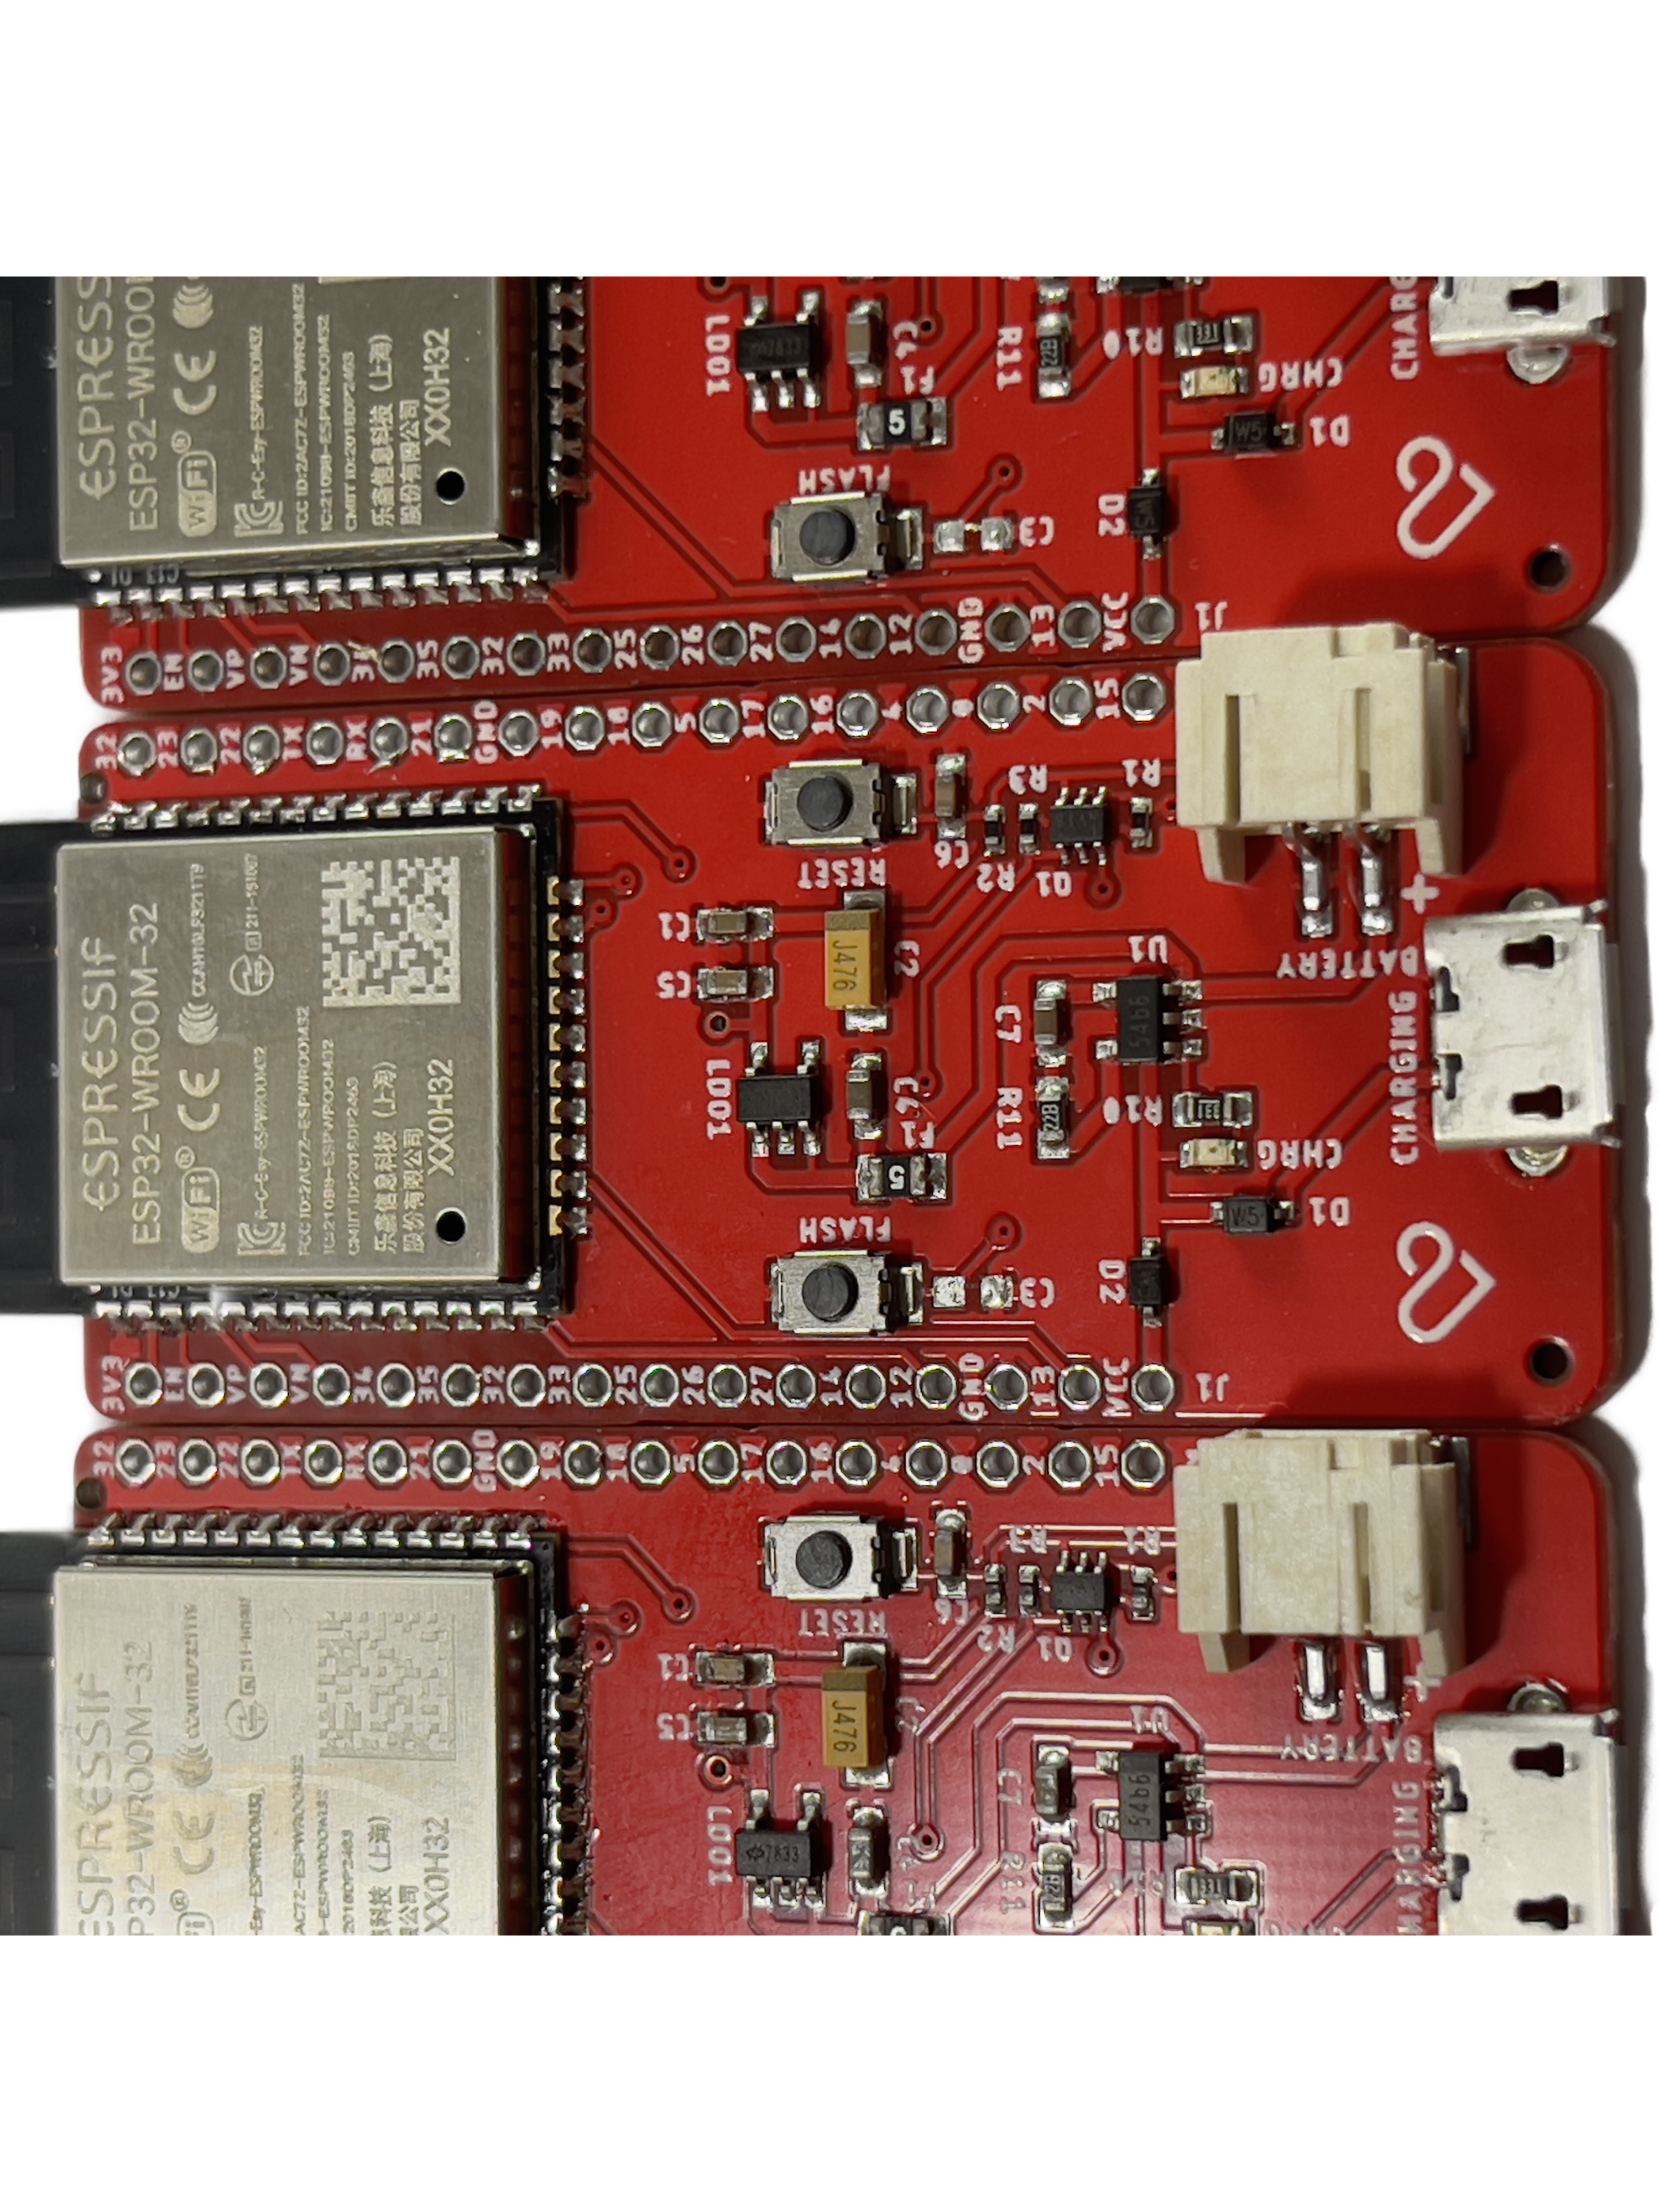
The Programmer Socket Interface consists of 6 pins.
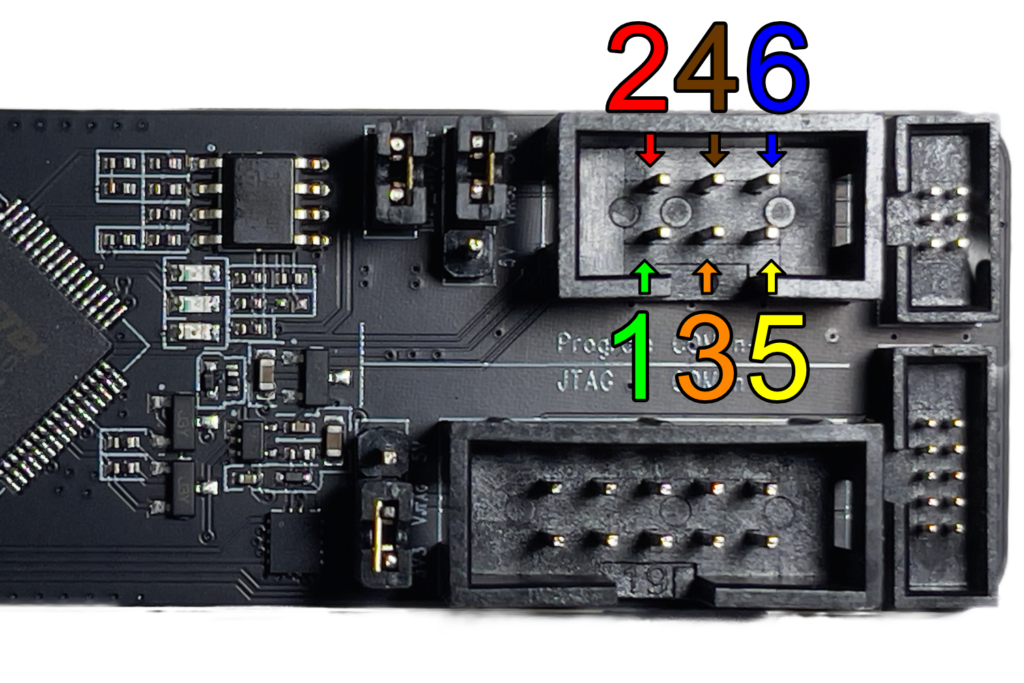
- EN Pin
- VCC (3.3v or 5v)
- TX
- GND (Ground)
- RX
- GPIO0 (Zero)
On the above image, the numbers are colour-coordinated to match the wires I am using in my own configuration for this article.
I always try to keep my wire colours consistent, so knowing that red means voltage, brown means ground, orange means TX and yellow means RX is very helpful.
It is also worth noting that these wire colours correspond to my Dupont jumper wire looms (as pictured in the earlier photographs showing what you need in order to follow this article)
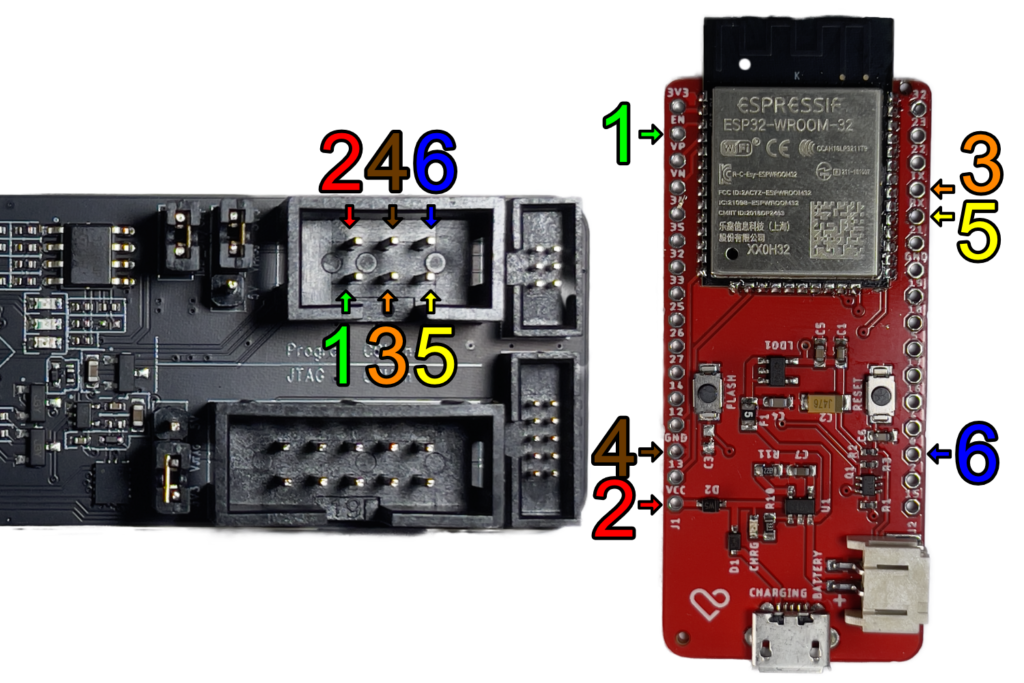
The above image illustrates the connections between the ESP-PROG’s Programmer Socket Pins, and an LPKit ESP32 Development Board’s GPIO Pin Header.
Why You Can’t Flash Your
Program Yet!
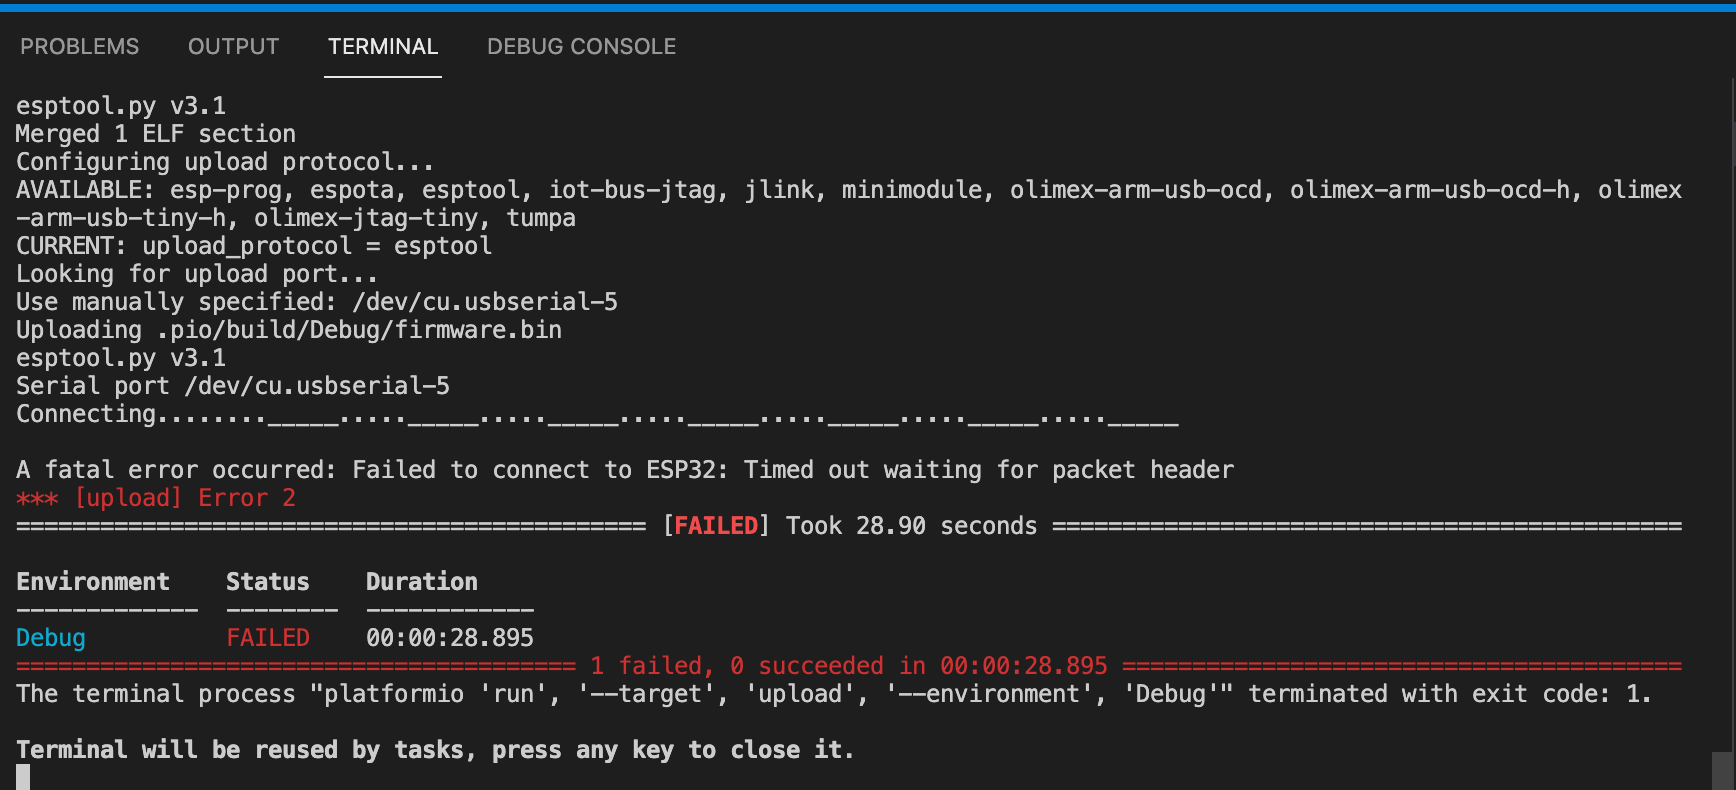
So, you’ve wired your ESP-PROG board’s Programmer wires to your ESP32, but you can’t Flash your program onto it without an error?
A fatal error occurred: Failed to connect to ESP32: Timed out waiting for packet header
Output from PlatformIO when attempting to Flash the Program onto the ESP32
*** [upload] Error 2
So, why does this happen?
Well, with 3.3v ESP32s, I have noticed that connecting only the Programmer interface of the ESP-PROG is insufficient. It has something to do with power, in that your ESP32 will operate normally, but will fail every time you attempt to flash it.
However, when you connect the Debugger interface of the ESP-PROG, along with its own 3.3v power and GND pins, everything will work perfectly.
Note: This issue does not occur with 5v ESP32 devices! If your ESP32 has a 5v input, and you set your ESP-PROG’s Programmer Jumper to 5v, it will operate perfectly without having to attach the additional wires from the Debugger interface.
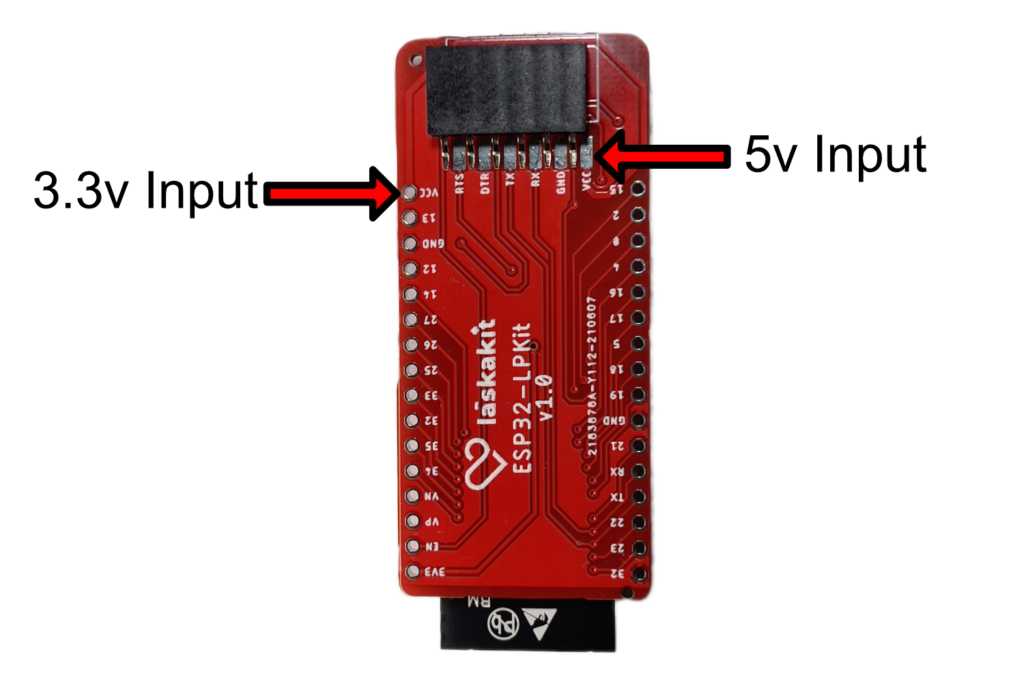
The ESP32 Development Board I show in the wiring diagram has, on its underside, a 5v input if an optional female socket header is soldered in place.
Using this 5v input, and putting the ESP-PROG’s Programmer Interface in 5v mode, I can eliminate the need to hook up the power pins from the Debugger Interface.
Of course, we haven’t even gotten to the Driver Installation yet, so you might not even have noticed this issue had I not mentioned it in this article.
Still, as the entire purpose of this article is to set up proper Debugging for ESP32 programs, this issue is not going to be a problem as we progress.
Wiring
The
Debugger
Now that the Programmer Interface of the ESP-PROG has been connected to your ESP32 Development Board, it’s time to connect the Debugger (JTAG) Interface.
The Debugger (JTAG) Interface on the ESP-PROG board consists of 10 pins. However, we shall only be using 7 of them.
Let’s take a look:
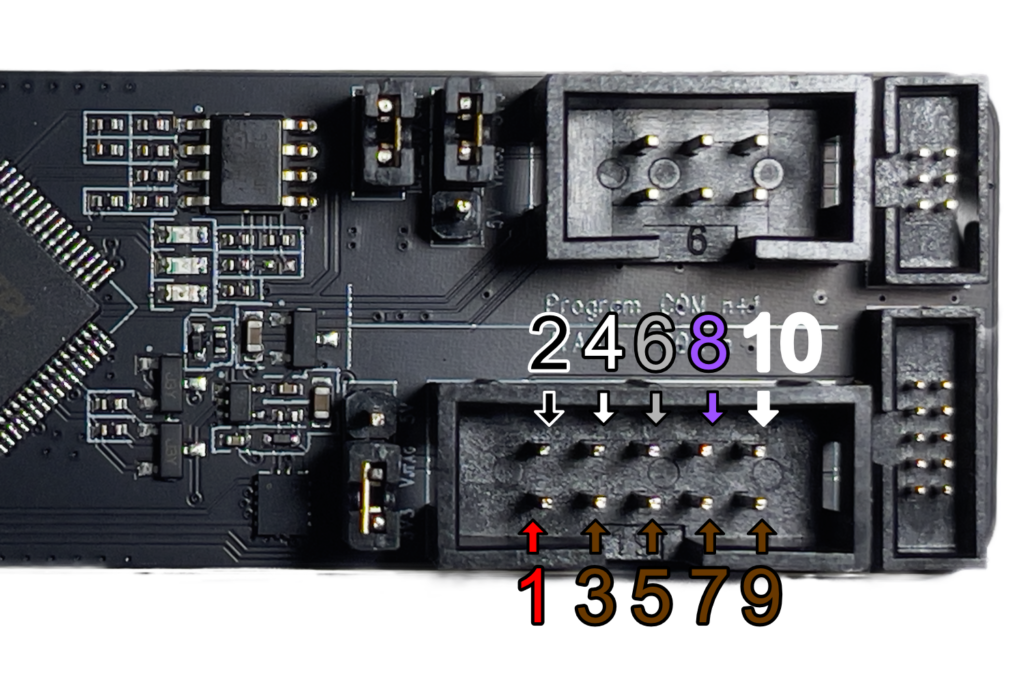
- VCC (3.3v or 5v)
- TMS
- GND (Ground)
- TCK
- GND (Ground)
- TDO
- GND (Ground)
- TDI
- GND (Ground)
- NC (Not Connected)
Again, I’ve colour-coordinated the numbers on the above illustration to match my own Dupont Jumper Wire loom. Sadly, while these looms begin with a nice “rainbow” of colours, they end with black, white, purple, and grey… I then looped around to a second red and brown (matching my standard of red for voltage, brown for ground).
Pins 3, 5, 7, and 9 are all Ground pins. You can choose whichever one of them you wish, but we only need to connect one of them.
Remember: If you previously connected the Programmer Interface to a 5v input pin, and set it to 5v mode, you don’t need to connect Pin 1 or 3/5/7/9.
Pin 10 is not connected to anything.
Now, let’s see where these wires need to connect on our ESP32 Development Board.
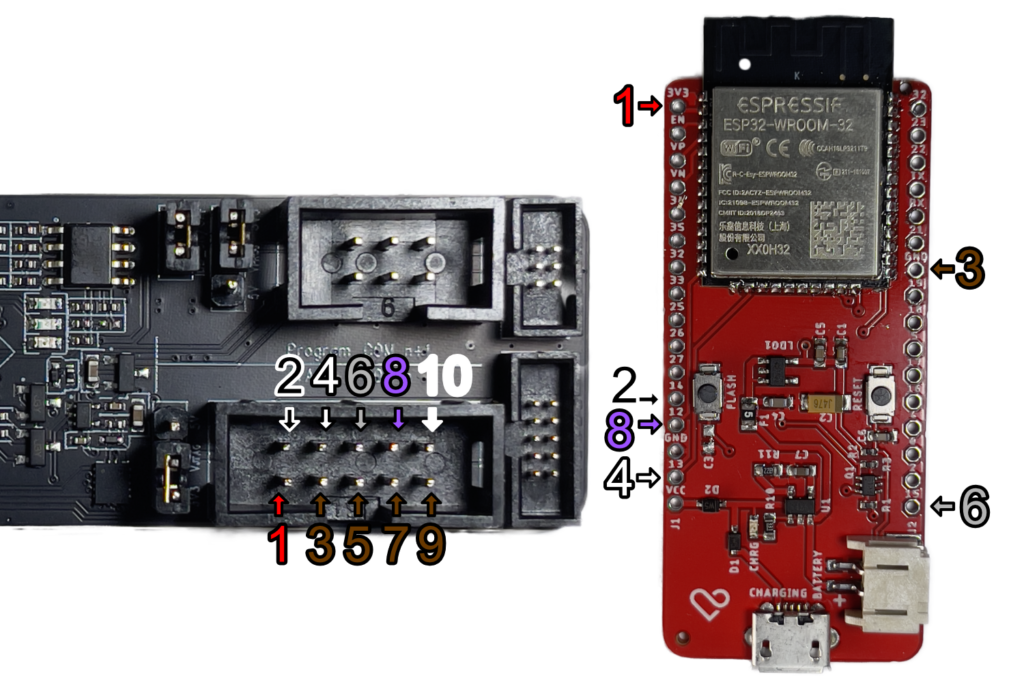
- Voltage connects to any Voltage Input Pin on your ESP32 Development Board. Just remember to match the voltage setting on the ESP-PROG board to the expected Voltage of your chosen Pin. In the image above, that’s 3.3v.
- TMS connects to GPIO14 on your ESP32 Development Board.
- Ground connects to any GND pin on your ESP32 Development Board.
- TCK connects to GPIO13 on your ESP32 Development Board.
- Not connected
- TDO connects to GPIO15 on your ESP32 Development Board.
- Not connected
- TDI connects to GPIO12 on your ESP32 Development Board.
- Not connected
- Not connected
That’s all of the wiring completed. Now we’re ready to begin setting your computer up so that we can use this hardware.
Virtual COM Port (VCP) Drivers
Before we begin using the ESP-PROG to Flash and Debug programs with our ESP32 Development Board, we need to install the VCP Drivers on our computer.
Because this process is different depending on which Operating System you use, and to ensure that the steps in this guide don’t become outdated, please follow this link to the official guide from Espressif on installing the VCP Drivers.
Be sure to download and install the appropriate VCP Drivers for your Operating System.
With the Drivers installed, we’re now ready to begin configuring a PlatformIO Project so that we can Flash it onto our ESP32, and Debug it.
Creating our PlatformIO Project
Let’s load up Visual Studio Code.
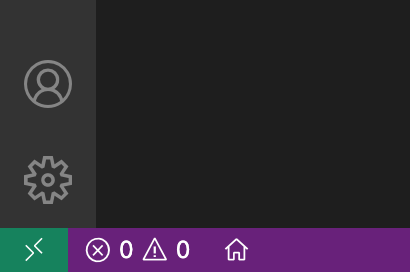
With PlatformIO installed in Visual Studio Code, the Toolbar at the bottom of you screen features an additional new ![]() icon.
icon.
Clicking on this icon will bring up the PlatformIO Home tab in Visual Studio Code.
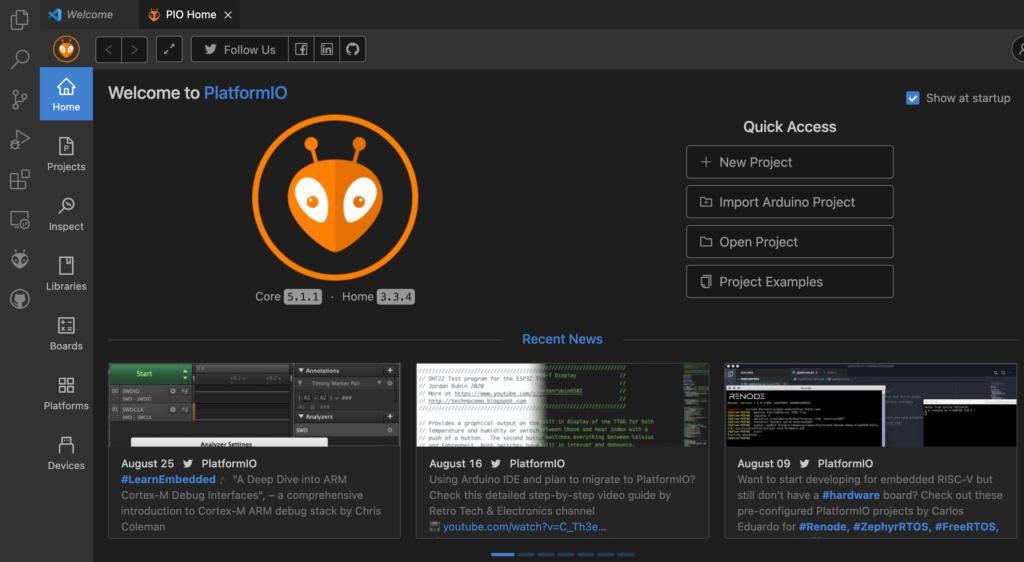
We’re going to click the New Project button.
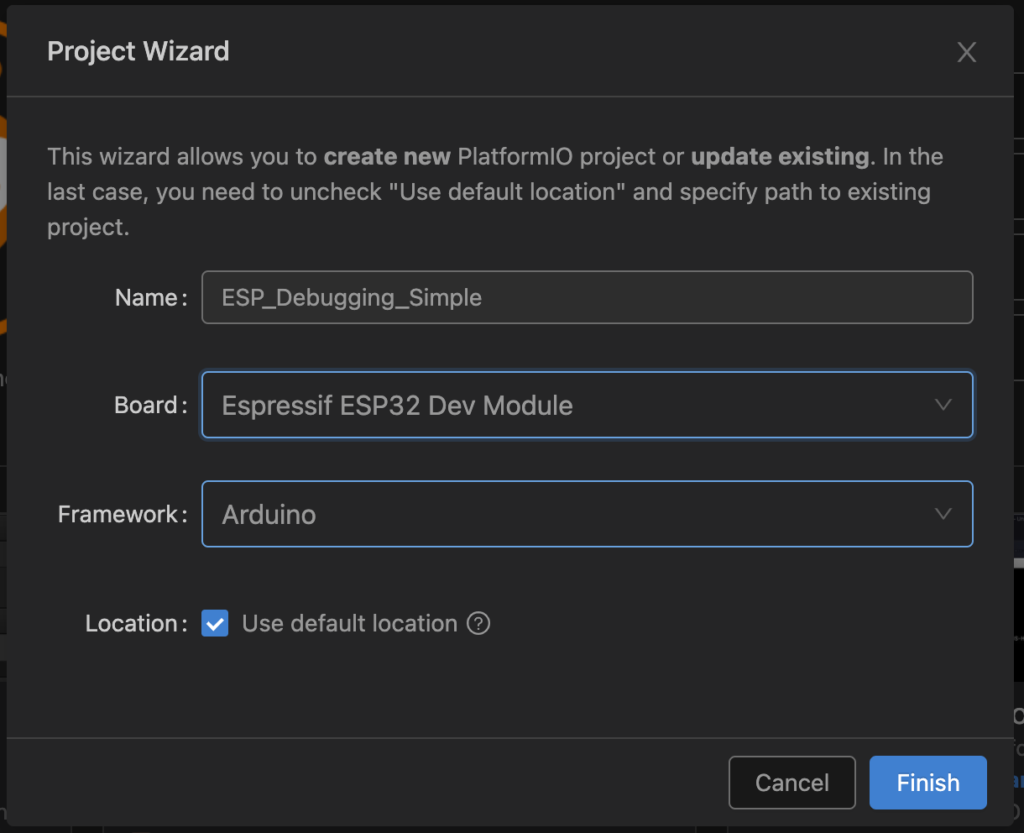
Enter a Name for your Project as you desire.
For my ESP32-WROOM-32 Development Boards, I select the Board as Espressif ESP32 Dev Module.
There are two available Frameworks. If you’re used to the more simplistic Arduino libraries, you’re able to use these perfectly on an ESP32. If you prefer to use the Espressif Framework (ESP-IDF), you can select it here.
For this demo, I’m choosing the Arduino Framework.
For Location, you can either save it to the Default location, or untick the box to select your own. This depends on where and how you manage your projects.
Hit Finish to create your empty Project.
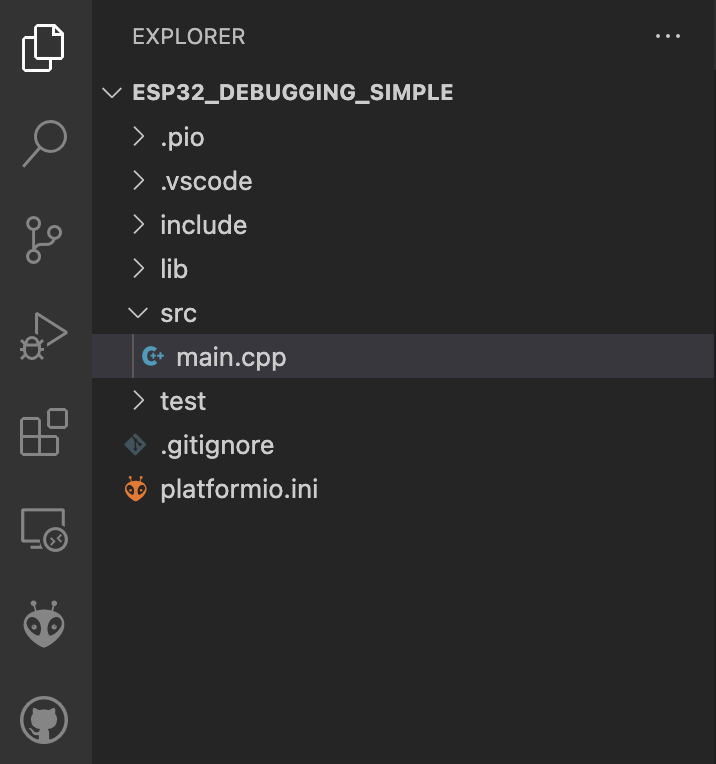
Once your project has been created, you will have a Folder Structure in the Explorer view looking just like this screenshot.
/src/main.cpp contains your setup() and loop() methods, just like an ino Sketch in the Arduino IDE.
Critically, this new Project contains a platformio.ini file, which we must properly configure before we can begin debugging any code.
So, let’s take a look at what the platformio.ini file looks like, and what it needs to look like for debugging to work.
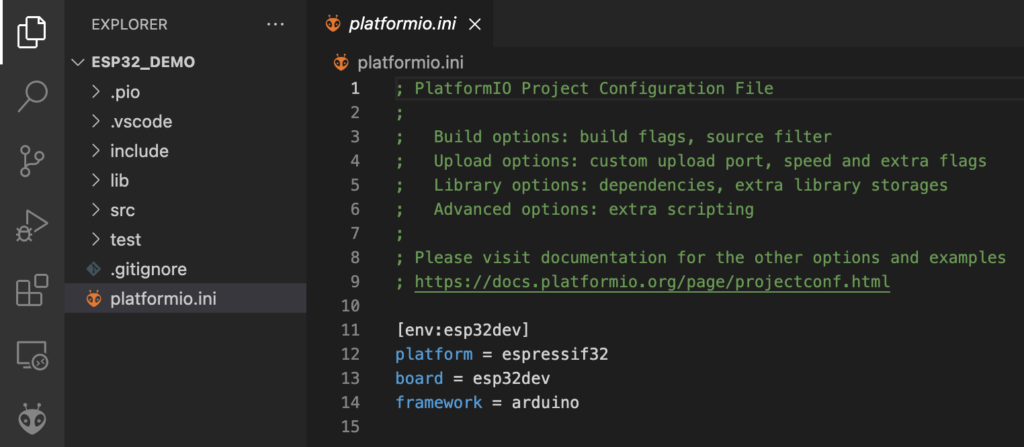
The above screenshot shows the contents of the default platformio.ini file, created each time you make a New Project.
This article won’t attempt to explain every possible configuration parameter and option within this ini file. That would be far too much to cover, and way outside the scope of debugging. Note that there is, however, a handy hyperlink in the auto-generated comment within the ini file. This link will enable you to explore all of the options available beyond those covered in this article.
Build Configurations
The default platformio.ini file presumes a single Release Build Configuration. In this case, they name it esp32dev to match the board specification.
When producing Projects that can be debugged, we need to have two Build Configurations. One for Release, and one for Debug.
That’s as easy as modifying the platformio.ini file to look more like the following:
; PlatformIO Project Configuration File
;
;   Build options: build flags, source filter
;   Upload options: custom upload port, speed and extra flags
;   Library options: dependencies, extra library storages
;   Advanced options: extra scripting
;
; Please visit documentation for the other options and examples
; https://docs.platformio.org/page/projectconf.html

[env:Release]
platform = espressif32
board = esp32dev
framework = arduino

[env:Debug]
platform = espressif32
board = esp32dev
framework = arduino
Now, the above ini file defines two identical configurations, but with two different names (Release and Debug respectively)
However, both configurations are going to share most of their settings… so we really need to produce a Common configuration to hold these shared settings:
; PlatformIO Project Configuration File
;
;   Build options: build flags, source filter
;   Upload options: custom upload port, speed and extra flags
;   Library options: dependencies, extra library storages
;   Advanced options: extra scripting
;
; Please visit documentation for the other options and examples
; https://docs.platformio.org/page/projectconf.html

[common]
platform = https://github.com/platformio/platform-espressif32.git
board = esp32dev
framework = arduino

[env:Release]
platform = ${common.platform}
board = ${common.board}
framework = ${common.framework}

[env:Debug]
platform = ${common.platform}
board = ${common.board}
framework = ${common.framework}
Now, in the above modified ini file, we define a common section (which is not itself a Build Configuration) and share the properties of that section with both Build Configurations.
Also, notice that I have modified the platform value to use a GIT repository URL rather than the value of espressif32. This is to ensure that the latest version of this platform package is used by PlatformIO at all times.
Assigning COM Port Numbers and Baud Rates
At present, every time you attempt to Flash your blank Project to your ESP32 Development Board, you’re going to be presented with an error like the following:
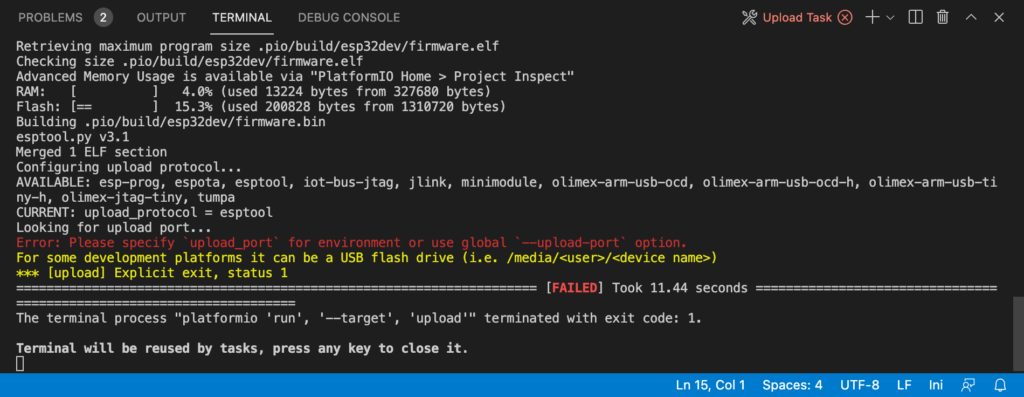
This is simply because PlatformIO does not know what COM Port to use to Flash your program to your ESP32 Development Board.
To fix this, we need to make some additions to our platformio.ini file:
; PlatformIO Project Configuration File
;
;   Build options: build flags, source filter
;   Upload options: custom upload port, speed and extra flags
;   Library options: dependencies, extra library storages
;   Advanced options: extra scripting
;
; Please visit documentation for the other options and examples
; https://docs.platformio.org/page/projectconf.html

[common]
platform = https://github.com/platformio/platform-espressif32.git
board = esp32dev
framework = arduino
monitor_port = /dev/cu.usbserial-5
monitor_speed = 115200
upload_port = /dev/cu.usbserial-5
upload_speed = 921000

[env:Release]
platform = ${common.platform}
board = ${common.board}
framework = ${common.framework}
monitor_port = ${common.monitor_port}
monitor_speed = ${common.monitor_speed}
upload_port = ${common.upload_port}
upload_speed = ${common.upload_speed}

[env:Debug]
platform = ${common.platform}
board = ${common.board}
framework = ${common.framework}
monitor_port = ${common.monitor_port}
monitor_speed = ${common.monitor_speed}
upload_port = ${common.upload_port}
upload_speed = ${common.upload_speed}
We have now added the following properties:
monitor_port– Defines the COM Port to use for the Serial Monitor (yourSerial.println("")calls)monitor_speed– Defines the Baud Rate for the Serial Monitor. This matches the Baud Rate you define when you callSerial.begin(115200).upload_port– Likemonitor_port, but this is specifically for Flashing your Program to your ESP32.upload_speed– The Baud Rate to be used for Flashing your Program to your ESP32.
Note that upload_speed for most ESP32 Development Boards supports a nice high Baud rate of 921000. If you have issues with this, lower the value to 115200, which is slower but more compatible.
What Port Numbers Do I Need?
If you’re a Windows user, you may think that the values for my COM ports looks strange. You’re used to simple definitions like COM1, COM2 etc. These are Unix COM port “mounts.”
If in doubt about which COM port to use, we can quite easily determine which Port is the one we need.
You will first need to comment out a couple of lines in the platformio.ini file:
; PlatformIO Project Configuration File
;
;   Build options: build flags, source filter
;   Upload options: custom upload port, speed and extra flags
;   Library options: dependencies, extra library storages
;   Advanced options: extra scripting
;
; Please visit documentation for the other options and examples
; https://docs.platformio.org/page/projectconf.html

[common]
platform = https://github.com/platformio/platform-espressif32.git
board = esp32dev
framework = arduino
monitor_port = /dev/cu.usbserial-5
monitor_speed = 115200
upload_port = /dev/cu.usbserial-5
upload_speed = 921000

[env:Release]
platform = ${common.platform}
board = ${common.board}
framework = ${common.framework}
;monitor_port = ${common.monitor_port} ; < COMMENTED OUT
;monitor_speed = ${common.monitor_speed} ; < COMMENTED OUT
;upload_port = ${common.upload_port} ; < COMMENTED OUT
;upload_speed = ${common.upload_speed} ; < COMMENTED OUT

[env:Debug]
platform = ${common.platform}
board = ${common.board}
framework = ${common.framework}
;monitor_port = ${common.monitor_port} ; < COMMENTED OUT
;monitor_speed = ${common.monitor_speed} ; < COMMENTED OUT
;upload_port = ${common.upload_port} ; < COMMENTED OUT
;upload_speed = ${common.upload_speed} ; < COMMENTED OUT
On the Status Bar at the bottom of your Visual Studio Code window, you will see the following icon: ![]()
Clicking on this icon will bring up the Serial Monitor, with a prompt looking something like this:
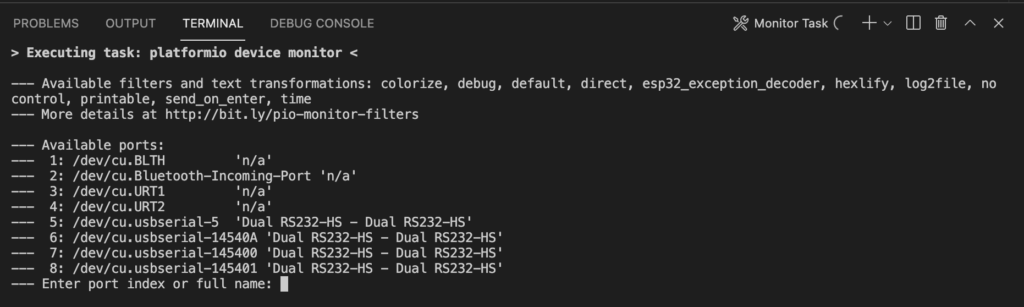
We can select one of the available ports by pressing the key representing the corresponding index (to number to the left of the port name). We then hit the Reset button on the ESP-PROG board, and look for any output on this Terminal tab.
Once we see output, we know that we have identified the port number of the ESP-PROG board.
Remember: this screenshot is from a Unix-based Operating System. Windows Port Numbers are very different, but the principle is exactly the same.
Once you have identified the correct Port Number, place the name as shown in the Available Ports list (screenshot above) in both the monitor_port and upload_port settings in your platformio.ini file.
In my case, I have identified the ESP-PROG COM port as being /dev/cu.usbserial-5, so this is the value I need in my platformio.ini file, which, once put in place, looks like this:
; PlatformIO Project Configuration File
;
;   Build options: build flags, source filter
;   Upload options: custom upload port, speed and extra flags
;   Library options: dependencies, extra library storages
;   Advanced options: extra scripting
;
; Please visit documentation for the other options and examples
; https://docs.platformio.org/page/projectconf.html

[common]
platform = https://github.com/platformio/platform-espressif32.git
board = esp32dev
framework = arduino
monitor_port = /dev/cu.usbserial-5
monitor_speed = 115200
upload_port = /dev/cu.usbserial-5
upload_speed = 921000

[env:Release]
platform = ${common.platform}
board = ${common.board}
framework = ${common.framework}
monitor_port = ${common.monitor_port}
monitor_speed = ${common.monitor_speed}
upload_port = ${common.upload_port}
upload_speed = ${common.upload_speed}

[env:Debug]
platform = ${common.platform}
board = ${common.board}
framework = ${common.framework}
monitor_port = ${common.monitor_port}
monitor_speed = ${common.monitor_speed}
upload_port = ${common.upload_port}
upload_speed = ${common.upload_speed}
However, while this now makes it possible to Flash our built Project (the Program) onto our ESP32 Development Board, it does not yet make it possible to Debug.
We’re missing a couple of lines of configuration.
At the bottom of the [env:Debug] Build Configuration, we need to add the following lines:
; Now for the Debug-Specific Settings
debug_tool = esp-prog
debug_init_break = tbreak setup ; tbreak = Breakpoints. setup = Break on setup() method start
This informs PlatformIO that we are using the ESP-PROG debugger function, and defines the conditions under which we want the Debugger to halt execution.
debug_init_break defines two conditions: tbreak and setup.
tbreak tells the Debugger that whenever we place a Breakpoint in our code, we want execution to halt and the IDE to interrupt so that we can debug our code.
setup tells the Debugger that, the moment our Program enters the setup() function, we want to halt execution and the IDE to interrupt so that we can debug our code. In this case, this would be useful to see the state of the system before setup() executes.
This is all we need to configure in order to be able to deploy a Debug build of our Program to our ESP32 Development Board, and actually Debug it.
Build a Debuggable Version of a Program
All we need to do to build and Flash the Debuggable version of our Program is switch our Build Configuration to our Debug Config.
This is simple to do:

The above screenshot shows the Status Bar of Visual Studio Code for our PlatformIO Project.
The highlighted item is the current Build Configuration, followed by (in braces) the name of the Project.
In the case of the above Screenshot, I’ve already selected the Debug configuration.
All we need to do to select a Build Configuration is to click on that segment of the Status Bar, which will bring up a Drop-Down Selection at the top of Visual Studio Code looking like the following:
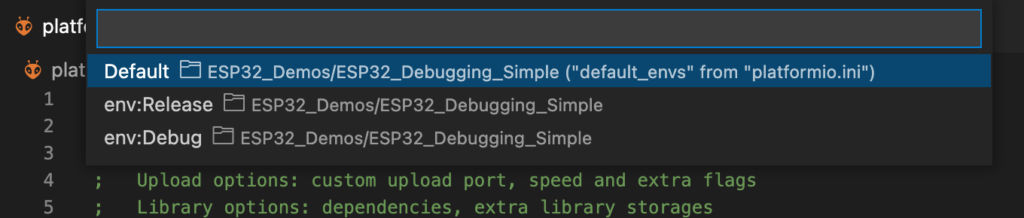
From that Drop-Down Menu, we can choose either env:Release or env:Debug.
For debugging, we of course choose env:Debug. When we are not running our program on the Debugger, we would want to Flash a build from env:Release instead.
Flashing the Build to your ESP32
Now we have defined our Build Configurations, and we know how to switch between them in the IDE.
However, now we need to know how to Flash the Program (built with whichever Build Configuration we have selected) to our ESP32.
The following icon on the Status Bar at the bottom of the Visual Studio Code IDE for a PlatformIO Project will Flash your Build onto your ESP32: ![]()
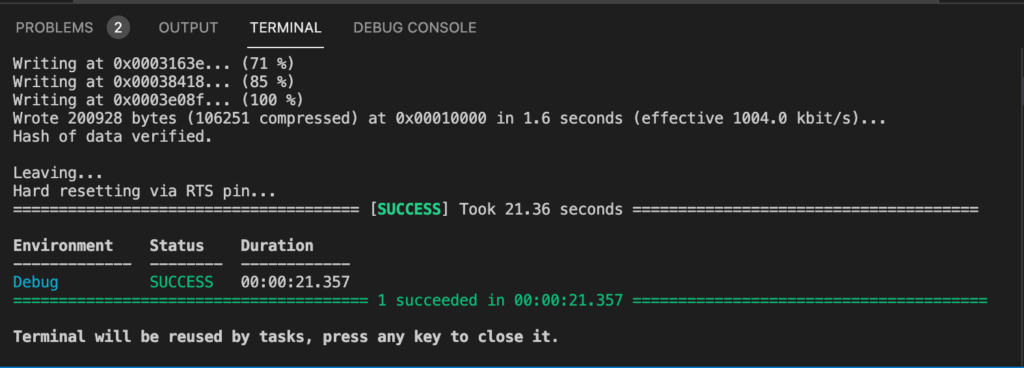
The above screenshot shows pretty-much exactly what you should see when you successfully Flash the Debug configuration of our blank PlatformIO Project to your ESP32 Development Board.
Starting the Debugger
Okay, great, we’re able and ready to flash a Program, with Debugging Enabled, onto our ESP32. Now we need to be able to start debugging it!
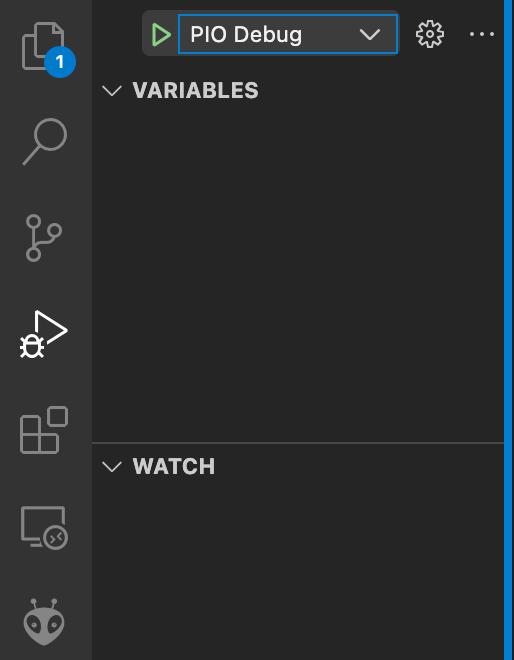
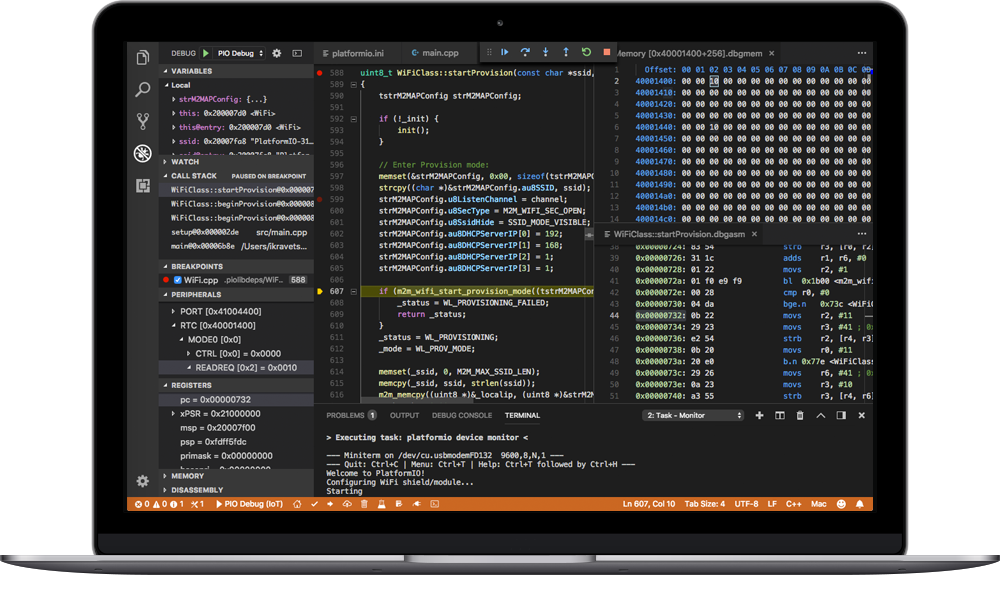
This screenshot shows the Debug view of Visual Studio Code, denoted by the “Play” icon with the little insect on it.
When you switch to this view, you will notice a drop-down list at the top of the screen immediately to the right. In this screenshot it says “PIO Debug”. Make sure yours is set to the same.
Now, simply press the green “Play” icon to the left of that drop-down list.
You will see a Build occur in the Terminal panel, followed by the build being Flashed onto your ESP32.
After a sight delay, the Terminal panel will switch over to the Debug Console tab, and – a moment later – your first Breakpoint will be reached.
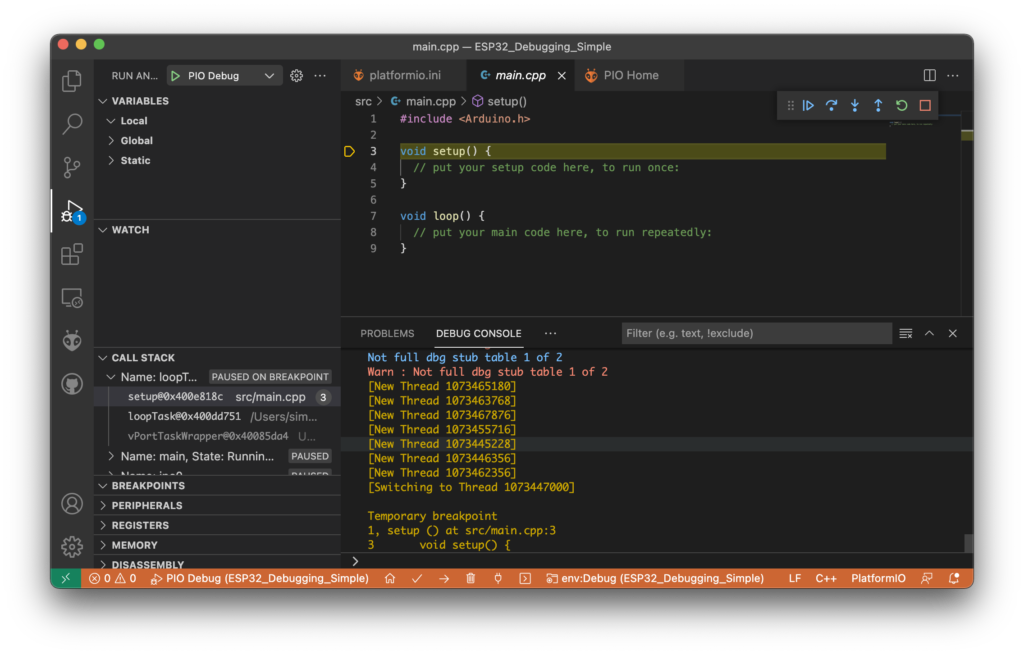
The above screenshot shows what you should see on your screen at this moment.
On the left-hand side, there’s a Tree display with a root node called Variables. If you expand Global, you will see all of the Global Variables defined by your chosen Framework (in the case of this demonstration, those would be from the Arduino Framework).
If you expand this, you should be sure to collapse it again before continuing execution, as the update of this Tree is very time-consuming when visible, and slows down your debugging session noticeably.
More importantly, any Local variables we define can be easily interrogated any time execution halts for one of our Breakpoints.
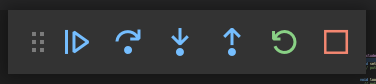
Before we proceed further, I draw your attention to the Debugger Controls, near the top-right side of the Visual Studio Code window:
These controls can progress and even terminate the Debugger. You should familiarise yourself with them, as they are extremely useful for debugging your code.
Left-To-Right:
- Continue (F5) – will move on until the next Breakpoint is reached (if ever)
- Step Over (F10) – Advances to the next line in the current Method
- Step Into (F11) – Steps into a method being invoked by an instruction from the current line of code.
- Step Out (Shift + F11) – Will allow the remainder of the current Method to complete until it returns, and then will break at the point the Method returns.
- Restart – Will Restart the Debugger entirely.
- Stop – Will terminate the Debugger completely.
A very basic Debuggable Program
So, now that we can Debug a Program on an ESP32 Development Board, let’s make something simple so we can interrogate a few Variables/Members on the Debugger.
In the /src/main.cpp file, place the following code:
#include <Arduino.h>

class SomeClass{
  public:
    String Foo;
    int SomeInteger;
};

enum SomeEnum {
  EnumValueA,
  EnumValueB,
  EnumValueC
};

struct SomeStruct{
  double FieldA;
  bool FieldB;
  SomeEnum FieldC;
};

unsigned long nextTime = 5000;
SomeClass someClass;
SomeStruct someStruct;

void setup() {
  Serial.begin(115200);

  // Initialise someClass
  someClass.Foo = "Bar";
  someClass.SomeInteger = 1337;

  // Initialise someStruct
  someStruct.FieldA = 123.456;
  someStruct.FieldB = true;
  someStruct.FieldC = EnumValueA;

  Serial.println("Initialised"); // Set a Breakpoint on this line to interrogate someClass and someStruct
}

void loop() {
  if (millis() < nextTime) { return; } // Code won't proceed further until we reach the nextTime. A Breakpoint here will hit every time loop() is called

  // Breakpoints below this line will only hit every time the device counts 5 seconds!
  someClass.SomeInteger = someClass.SomeInteger * 2; // We double the value every 5 seconds
  someStruct.FieldA = someStruct.FieldA * 3; // We triple the value every 5 seconds

  nextTime = millis() + 5000; // nextTime = Now + 5 Seconds. Place a Breakpoint here to look at the updated values above!
}
The above code simply gives us some values we can interrogate on the Debugger. It isn’t particularly useful in terms of a program, and is certainly not a good example of clean code adhering to any SOLID principles.
So, let’s Flash this program onto our ESP32 by pressing the Arrow icon on the Status Bar: ![]()
Let’s place a Breakpoint on line 37 of /src/main.cpp. We do this by clicking on the margin to the left of the line of code, where a faded Red Dot will display. When a Breakpoint is placed, a bright Red Dot will be shown:

Note: clicking on that bright Red Dot again will remove the Breakpoint.
Now attach the Debugger by pressing the button with the icon of a Play arrow and a little insect on it: ![]() followed by the green Play button:
followed by the green Play button: ![]() … or just press F5 on your keyboard.
… or just press F5 on your keyboard.
The first breakpoint will hit at line 25, void setup() {, and you will be able to interrogate the initial states of our variables.
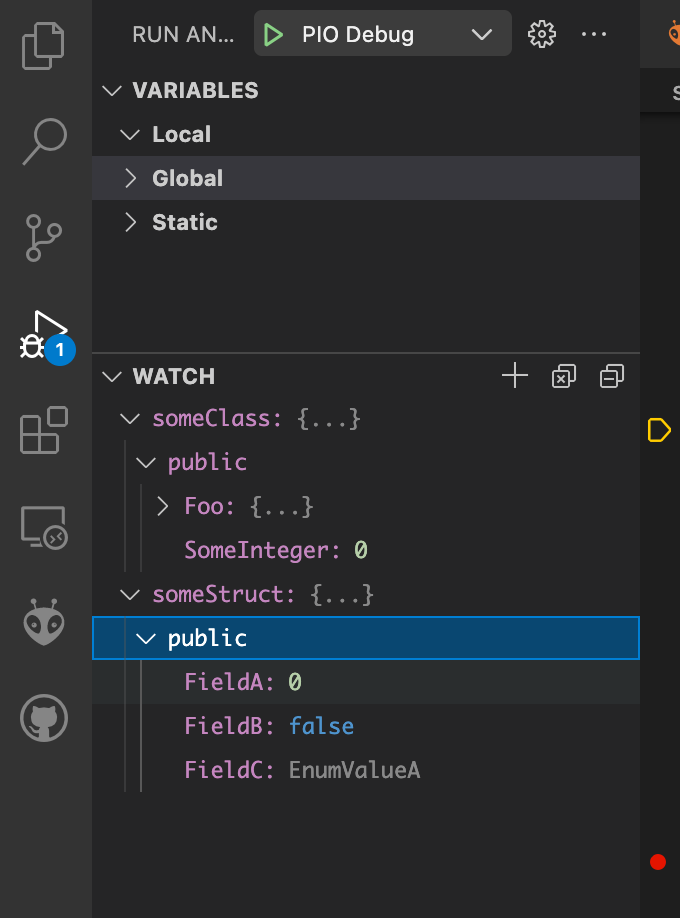
Because we have defined these variables Globally, you would have to either find them in the long list of Globals we discussed previously, or set a Watch for our specific variables as illustrated here.
Watches are easy to add. Simply press the + (plus) button, type in the exact name of the Variable, and hit Enter/Return on your keyboard.
Now, every time execution Halts, the value of those Variables (presuming they are visible to the execution scope at which the program halts) will be immediately visible for you.
If you have a group of related variables to monitor, this is arguably the most efficient way to do so.
We can also interrogate individual values by hovering over any reference in the code. This is very useful if you want to check specific individual values occasionally, rather than constantly.
If you continue execution by pressing Continue (left-most button on the Debugger controls toolbar, or F5 on your keyboard) execution will halt again on Line 37, at our Breakpoint. You will then be able to see that the value of the Members of our Variables have been set to the values defined in Lines 29-35.
There’s so much more to debugging!
This article barely scratches the surface when it comes to the uses of debugging. The subject is massive in its own right, and – if you’re interested – you would do well to continue researching it.
What you need to know is that, with the ESP-PROG debugger now hooked up, configured, and working; you can perform any level of debugging you would be able to perform for programs on conventional Operating Systems.
There are no longer any limitations holding you back!
In Conclusion
You now have no more reason to be relying on “Debug Messages” in your code.
You can write comprehensive, real-world programs for your ESP32 microcontrollers, configure them for Debugging, Flash them every time you need to directly to your ESP32 Development Board, and step through them as much as necessary to diagnose problems.
Welcome to the world of professional Microcontroller Software Development!
If you encounter any problems while following this article, you are more than welcome to reach out for assistance. You can leave a comment with your questions or details of any problem you may encounter here on this post, or you can join us in the Flowduino Discord server.

Great article! I specifically appreciate the detail makes it easy to understand. One question I have is on the drivers. Many other folks who have described their JTAG setup process urge the use of the Zadig utility and manually installation of FTDI drivers to properly remap devices for the prog board. I didn’t see that in your tutorial. Doesn’t seem like your process needs them. Thanks again!
Great tutorial, very thorough and detailed. Thanks for it.
A lot of code for ESP32 (and other microcontrollers) is developed using micropython or circuitpython these days. PlatformIO, as far as I am aware, supports only C/C++. VSCode however does support python, and there is a very nice extension for micropython that works very well for the Raspberry Pi Pico. Not a heck of a lot for ESP32 however. (or other boards if it comes to that.)
So, question. Can the ESP-debug tool be used to debug micropython (or circuitpython) on ESP32 boards?
Thanks, Ian